How Much Does a Renovation Cost? The Real Estate Investor’s Complete 2026 Budget Guide

The budget said $55,000. Clean scope, solid contractor, decent neighborhood. By week two of demo, the crew had pulled back drywall to find rotted framing, outdated knob-and-tube wiring, and a plumbing stack that hadn’t been touched since 1971. Fourteen weeks later, the final invoice landed at $77,400. The deal still closed — barely — but the profit that looked like $42,000 on paper shrank to something that barely covered carrying costs.
This story isn’t unusual. It’s the rule, not the exception. And in almost every case, the gap between the estimate and the invoice traces back to the same three root causes: underestimating scope, skipping contingency, and having no system to track spend in real time.
Most guides covering house renovation cost are written for homeowners debating whether to remodel their kitchen before listing. This one is written for investors — people for whom the home renovation budget is not a lifestyle decision but a financial model. For fix-and-flip operators, BRRRR investors, and rental property renovators, knowing how much to renovate a house isn’t a matter of preference. It’s the difference between a deal that pencils and one that bleeds.
Here’s what you’ll get from this guide:
- The three renovation tiers and cost per square foot for each
- A line-by-line budget for a typical 1,500 sq ft fix-and-flip
- Room-by-room cost breakdowns for kitchens, bathrooms, and mechanical systems
- The five hidden cost factors that most reliably derail renovation budgets
- The tax classification framework that can save — or cost — you thousands
- How real-time budget tracking protects your profit margin from the first invoice to the last
Why Renovation Costs Hit Investors Differently Than Homeowners
There’s a temptation, especially early in an investing career, to treat renovation budgeting the same way a homeowner would. You walk the property, you estimate room by room, you call a contractor, and you get a number. The number goes into a spreadsheet. The deal looks good. You move forward.
The problem isn’t the process — it’s the stakes. For a homeowner, a kitchen remodel is a comfort upgrade. For an investor, it’s a capital allocation decision that affects ARV, loan eligibility, and net profit. These are fundamentally different disciplines.
“For a homeowner, a $10,000 overrun is a headache. For an investor, it’s a deal that no longer pencils.”
Understanding that distinction is the first step toward building the kind of renovation budget that actually holds up under pressure.
The 70% Rule — and Why Renovation Accuracy Is Everything
Fix-and-flip investors live by the 70% Rule. The principle is straightforward: you should not pay more than 70% of a property’s after-repair value (ARV) minus the cost of repairs. If a home’s ARV is $250,000 and your renovation budget is $50,000, the most you should pay for the property is $125,000. The math is simple. The execution is where investors get into trouble.
When renovation costs are underestimated — even modestly — the entire deal math collapses. A $10,000 overrun on a deal that had $15,000 in projected profit doesn’t just hurt. It transforms a good investment into a cautionary tale. This is why renovation cost accuracy isn’t just a budgeting exercise for investors. It’s the foundation of deal underwriting. Every dollar in your rehab estimate carries consequence.
The BRRRR Layer
For BRRRR investors, the stakes are even higher and more nuanced. The Buy-Rehab-Rent-Refinance-Repeat strategy is predicated on pulling equity back out through a refinance after the renovation and tenant placement. But the appraisal that supports the refinance is directly influenced by how well the renovation was executed — and how much it actually cost.
Overspend on the renovation, and you may not pull back enough capital to fund your next acquisition. Underspend and cut the wrong corners, and the appraisal comes in lower than expected. Either way, your ability to repeat the cycle is compromised. For BRRRR investors, renovation cost control isn’t just about this deal — it’s about the velocity of your entire portfolio. You can read more about the full financial framework this strategy requires in RealBooks’ 3-Phase Financial Framework for Fix-and-Flip Investors.
Rental Renovators: The ROI Pencil Test
Rental property investors face their own version of this problem. A $30,000 kitchen remodel sounds like a compelling upgrade — until you realize the rental market in your submarket only supports $150 more per month in rent. At that rate, you’d need 200 months — over 16 years — to recoup the renovation cost through increased rent alone. That’s before factoring in vacancy, maintenance, and capital cost.
Every renovation decision for a rental investor needs to pass a simple pencil test: does the cost of this improvement generate enough rent premium, tenant retention value, or property appreciation to justify the capital deployed? If it doesn’t pencil, it doesn’t get done. Full stop.
The Three Investor Types This Guide Serves
This blog is written for three distinct investor profiles, each with different renovation priorities:
- Fix-and-flip operators — renovating for resale, maximizing ARV per dollar spent
- BRRRR investors — renovating for appraisal, refinance, and portfolio velocity
- Rental property renovators — renovating for rent premium, tenant quality, and long-term asset value
The numbers matter differently for each. But the foundational framework — scope, cost, contingency, and tracking — applies to all three. And understanding why renovation costs hit investors differently is the lens through which every section of this guide should be read.
Now that the investor-specific framing is clear, let’s move to the most practical mental model in renovation budgeting: the three-tier scope framework.
Three Renovation Tiers: What Each Costs Per Square Foot in 2026
Before any contractor sets foot on a property, before any quote is requested, and certainly before any offer is made, every investor needs a working framework for estimating renovation scope. The three-tier model is that framework. It’s not a final number — it’s a starting point that allows you to move with speed and confidence during deal analysis.
According to Angi’s 2026 house renovation cost data, renovation costs average $15 to $60 per square foot on average across project types — a range wide enough to be nearly meaningless without context. The three-tier framework provides that context by anchoring cost-per-square-foot ranges to specific scopes of work.
Tier 1 — Cosmetic Rehab: $10–$25 per Square Foot
A cosmetic rehab touches the surface of a property without disturbing its bones. Think fresh paint throughout, new luxury vinyl plank flooring, updated light fixtures, landscaping cleanup, new hardware on existing cabinets, and minor cosmetic repairs. The structure is sound, the systems are functional, and the property just needs a visual refresh to compete at market.
For a 1,500 sq ft property, a cosmetic rehab runs roughly $15,000 to $37,500 in total. This is the fastest-moving tier — projects often complete in four to eight weeks — and carries the lowest risk profile of the three.
Investor use cases for Tier 1 include rental upgrades where the goal is tenant retention and minor rent increases, light BRRRR plays in markets with strong turnkey comps, and flip opportunities in neighborhoods where buyers expect move-in-ready but not luxury finishes.
Tier 2 — Moderate Rehab: $25–$60 per Square Foot
The moderate rehab is where most fix-and-flip projects live. This tier involves kitchen and bathroom remodels, new flooring, window or roof replacement, and selective mechanical updates — typically one or two systems rather than a full overhaul. The property has good bones, but buyers or tenants won’t settle for the existing condition.
For a 1,500 sq ft property, moderate rehabilitation runs $37,500 to $90,000. Timelines typically stretch to eight to sixteen weeks, and the complexity of managing multiple trades simultaneously increases the importance of real-time budget tracking.
Investor use cases for Tier 2 include mid-range flips in B-class markets, rental repositioning from C to B-class, and BRRRR plays where the renovation is meant to push the appraisal into a specific value band.
Tier 3 — Full Gut Renovation: $60–$150+ per Square Foot
A full gut renovation replaces everything — electrical, plumbing, HVAC, insulation, drywall, kitchen, all bathrooms, roof, and often windows and siding. There may be foundation work involved. The property is essentially stripped to its frame and rebuilt from the inside out.
For a 1,500 sq ft property, a full gut renovation ranges from $90,000 to $225,000 or more depending on location, material grade, and the complexity of what’s discovered mid-demolition. Timelines can stretch to six months or beyond, and contingency planning becomes non-negotiable at this tier.
Investor use cases for Tier 3 include distressed acquisitions bought significantly below market, value-add flips in premium or luxury markets where ARV justifies the investment, and properties with severe deferred maintenance or structural compromise.
Using the Tiers in Practice
The practical application of the three-tier framework is simple: walk the property before making an offer, assign it to a tier based on what you observe, and then sanity-check your offer price against deal math using the cost-per-square-foot range for that tier. If the numbers still work at the high end of the range — plus contingency — the deal may be worth pursuing.
One important caveat: cost per square foot is a starting point, not a final number. Local labor markets create significant variance. Skilled trade labor in a high-cost coastal market may run two to three times what it costs in a Midwest market. Material quality choices will push costs within the tier range. And property-specific surprises — discovered during demo or inspection — can push a Tier 2 project into Tier 3 territory without warning.
This is the foundation of any reliable rehab cost estimator: tier assignment, regional adjustment, and contingency buffer. RealBooks’ AI project builder, Dollar Bill, uses this same structure — building room-by-room project budgets informed by regional labor and material cost data so that your estimate starts closer to reality.
The tiers give you a ballpark. Investors don’t run deals on ballparks — they run them on line items. Let’s break down renovation costs room by room and system by system.
A Room-by-Room Renovation Budget for a 1,500 Sq Ft Fix-and-Flip
This is the section most investors bookmark and send to their partners. Not because the numbers are surprising, but because having them in one place — organized by trade and room, with investor-specific context for each — is exactly what’s needed when you’re evaluating a deal under time pressure.
The ranges below reflect 2026 market conditions for mid-range materials and standard labor. Premium finishes and high-cost labor markets will push numbers toward the higher end. Budget markets and investor-grade materials will pull them lower. Use these as calibrated benchmarks, not fixed quotes.
Kitchen Remodel
The kitchen is the single highest-impact room in most flip markets. Buyers make emotional decisions in kitchens. A well-executed kitchen remodel drives ARV more reliably than almost any other improvement — but it also carries the highest risk of over-improvement for the neighborhood.
- Minor refresh (new hardware, paint, updated appliances, lighting): $5,000–$15,000
- Mid-range remodel (new cabinets, countertops, appliances, backsplash, sink and fixtures): $25,000–$55,000
- Full gut kitchen (custom cabinetry, stone counters, high-end appliances, floor-to-ceiling tile): $60,000–$100,000
The investor’s rule: match the kitchen quality to the neighborhood’s price point, not your personal aesthetic. A $70,000 kitchen in a $200,000 ARV neighborhood is capital destruction.
Bathroom Remodel (Per Bath)
Bathrooms are high-leverage rooms — buyers notice them immediately, and outdated bathrooms tank offers. The cost-per-bathroom breakdown:
- Minor update (new fixtures, vanity, paint, mirror, toilet): $4,000–$12,000
- Mid-range remodel (new tile, shower surround, vanity, plumbing fixtures): $12,000–$30,000
- Full gut bathroom (complete demolition and rebuild, including floor and wall tile, new shower, soaking tub): $25,000–$60,000
Flooring (Whole House)
For the full 1,500 sq ft, expect $4,500–$12,000 for flooring. Luxury vinyl plank (LVP) has become the investor’s go-to material — it’s durable, waterproof, visually appealing to buyers and tenants, and installs faster than hardwood or tile. A single flooring choice run throughout the home also creates visual continuity that makes smaller spaces feel larger.
Roof Replacement
If the roof needs to go, it goes. There’s no negotiating with buyers, lenders, or appraisers on this one. Budget $8,000–$15,000 for a standard shingle roof replacement on a 1,500 sq ft home. Metal roofing and higher-grade materials will push this number higher.
HVAC System Replacement
A full HVAC system replacement — new furnace or air handler, condenser, ductwork connections — runs $5,000–$12,000 for a 1,500 sq ft home. Partial replacements (condenser only, or furnace only on a two-component system) will come in at the lower end. Buyers and appraisers both respond positively to a new HVAC system, and it eliminates one of the most common inspection contingencies.
Electrical (Panel and Wiring)
Older homes — particularly those built before 1980 — frequently require electrical panel upgrades to meet current code requirements. Budget $2,000–$8,000 for panel and selective wiring work. Full rewires on larger or older homes can exceed this range significantly. Code compliance is non-negotiable when a property will be listed or rented.
Plumbing (Pipes and Fixtures)
Selective plumbing work — updating fixture connections, replacing supply or drain lines in targeted areas, installing new fixtures — typically runs $2,000–$6,000. Full plumbing system replacement on a distressed property can reach well beyond this range and should be treated as a Tier 3 line item.
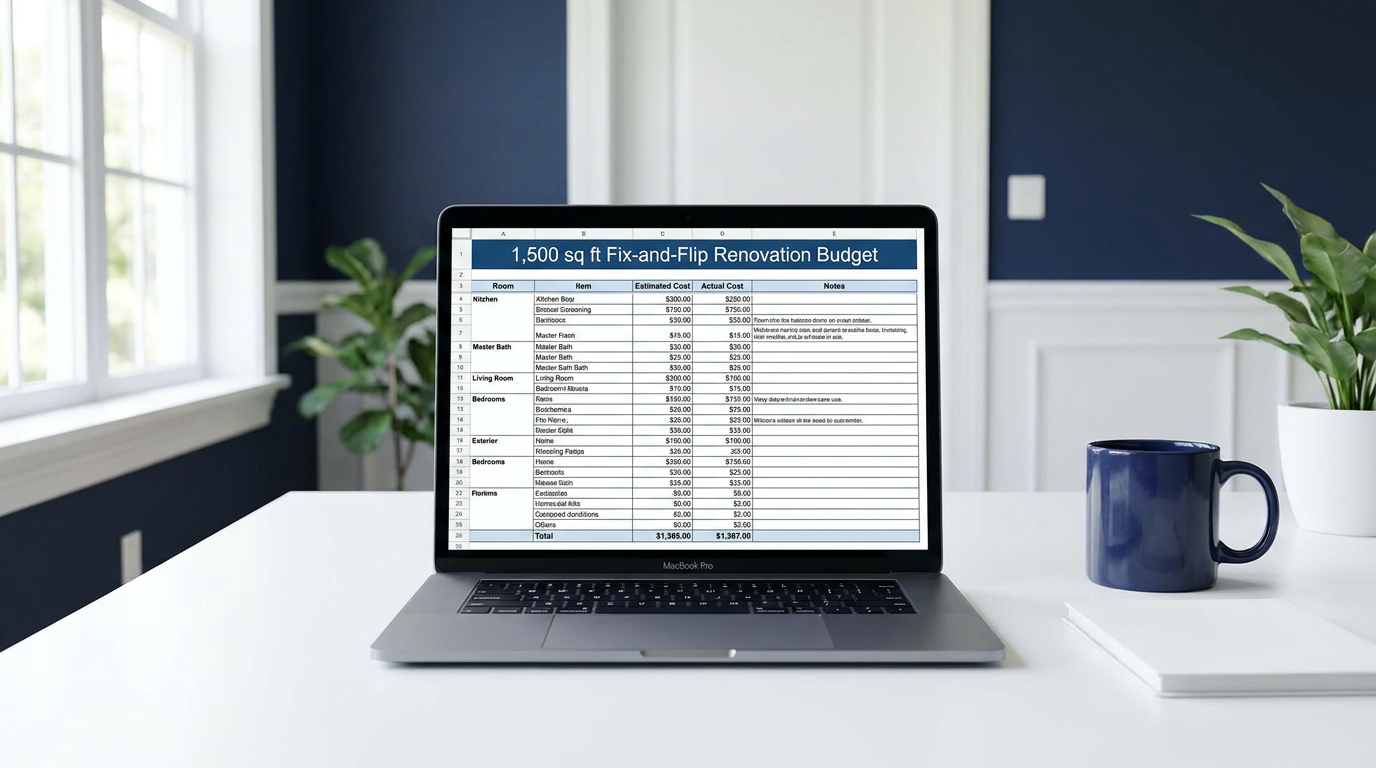
The Full Sample Budget: 1,500 Sq Ft Fix-and-Flip
Here’s what a complete moderate renovation budget looks like in practice, before contingency:
- Kitchen remodel: $15,000–$35,000
- Bathroom remodels (1–2 baths): $8,000–$18,000
- Flooring (whole house): $4,500–$12,000
- Roof replacement: $8,000–$15,000
- HVAC system: $5,000–$12,000
- Electrical: $2,000–$8,000
- Plumbing: $2,000–$6,000
- Paint (interior and exterior): $3,000–$6,000
- Landscaping and exterior cleanup: $1,500–$4,000
- Permit fees and inspections: $1,000–$3,000
- Miscellaneous and finishing: $2,000–$5,000
Total estimate: $52,000–$124,000 — depending on the extent of kitchen and bath work, material grade, and local labor rates.
For reference, full gut renovation ranges scale significantly with home size:
- Under 1,500 sq ft: $75,000–$175,000
- 1,500–2,500 sq ft: $120,000–$280,000
- 2,500+ sq ft: $200,000–$500,000+
According to BiggerPockets’ comprehensive guide to the cost of flipping a house, labor typically accounts for 30–50% of the total renovation budget, with materials making up 25–40%. Understanding this split helps investors evaluate contractor bids — if a quote is light on labor but heavy on materials, or vice versa, it’s worth digging into the assumptions behind it.
Setting up your budget is step one. Protecting it from the forces that predictably blow it up is step two — and that’s where most investors fall short.
The 5 Budget Killers That Blow Renovation Estimates — And How to Survive Them
Every experienced investor has a version of the story from the introduction. The budget looked solid. The contractor was reliable. And then something happened — something that wasn’t in the scope, wasn’t in the estimate, and definitely wasn’t in the profit projection. This section is about naming those forces so you can anticipate them, plan for them, and survive them without losing your shirt.

Budget Killer #1: Hidden Structural Issues
Water damage that migrated behind finished walls. Damaged roof decking invisible from street level. Framing rot in a load-bearing wall. Foundation settlement that only became apparent once the floor was pulled up. These are the discoveries that happen during demolition — not during a walkthrough — and they are the single most common cause of renovation budget overruns.
Pre-purchase inspections catch some of these issues. A good inspector with a moisture meter, thermal imaging camera, and experience in older homes catches more. But even the best inspection can’t see through drywall. This is precisely why contingency exists — not as a pessimistic hedge, but as an honest acknowledgment that construction is inherently a discovery process.
Budget Killer #2: Scope Creep
“While we’re in there, let’s also…” is the most expensive sentence in real estate investing. It sounds practical. It even is practical sometimes — if you’re already opening the wall, adding that outlet makes sense. But unchecked scope creep is a slow financial hemorrhage. Each individual addition seems minor. The cumulative effect is a project that runs 20% or 30% over budget and four weeks over schedule.
The fix is a locked scope of work, documented in writing, before any contractor begins. Change orders should require investor sign-off and explicit acknowledgment of cost impact. Every addition to scope should be weighed against the deal math, not approved because it’s convenient.
Budget Killer #3: Code Compliance Surprises
Older homes carry hidden compliance liabilities that don’t surface until permits are pulled. A pre-1978 property triggers lead paint disclosure requirements — and if lead paint is disturbed, EPA-certified abatement is required, adding $3,000–$15,000+ depending on scope. Homes of similar vintage may contain asbestos in insulation, floor tiles, or roofing materials, adding another $5,000–$20,000 for licensed remediation.
Beyond hazardous materials, electrical panels in pre-1990 homes frequently don’t meet current code, which means an upgrade becomes mandatory when permits are pulled for other work. Plumbing upgrades trigger similar requirements. These aren’t optional — inspectors and municipalities enforce them — and they need to be anticipated at the underwriting stage, not discovered mid-project.
Budget Killer #4: Material and Labor Cost Increases
The 2025–2026 construction environment has been defined by two persistent pressures: material price volatility driven by supply chain dynamics and tariff adjustments, and skilled labor shortages in key trades — particularly electricians, plumbers, and HVAC technicians. Both forces push renovation costs higher than historical averages.
The practical implication for investors: lock in material prices and contractor rates before the project begins wherever possible. Avoid open-ended time-and-materials contracts where you absorb every cost increase in real time. Fixed-price contracts with clearly defined change-order procedures give you far more budget protection.
Budget Killer #5: Inadequate — or Zero — Contingency
This is the most avoidable budget killer on the list, and the most common. Some investors skip contingency entirely, reasoning that it’s money they don’t want to spend. Others allocate 5% — a number that sounds responsible but evaporates quickly the moment anything goes sideways. Neither approach survives contact with a real renovation.
The professional standard for contingency is:
- Cosmetic rehab (Tier 1): 10% contingency minimum
- Moderate rehab (Tier 2): 15% contingency
- Full gut or older homes (Tier 3): 20% contingency minimum
In practice: if your moderate rehab budget is $60,000, add $9,000 for contingency and plan for $69,000. If you spend only $60,000, you’ve had a good project. If you need the contingency, you’ve had a normal one.
“Contingency isn’t pessimism — it’s professional underwriting. Budget 10–20% above your estimate on every project, every time.”
One final note: investors who track budget versus actual spend in real time can catch overruns early — at $3,000 over, not $18,000 over. That window for corrective action is the difference between a tightened scope and a deal that no longer pencils. RealBooks’ expense management tools are built specifically to give investors that visibility as each invoice arrives, not after the project closes.
Understanding what blows budgets is critical. But there’s one more layer that most investors miss entirely — and it can cost more than any single budget overrun: how your renovation expenses are classified for tax purposes.
Repairs vs. Capital Improvements: The Tax Classification That Changes Everything
This is where renovation budgeting intersects with tax strategy — and where the difference between a well-documented project and a disorganized one becomes measurable in thousands of dollars.
Most investors understand, in a general way, that renovation expenses affect their taxes. Fewer understand the specific IRS framework that governs how they affect taxes. And fewer still have a tracking system that captures every invoice with enough granularity for their CPA to make the optimal classification call at year-end.

The Core IRS Distinction
The IRS draws a clear line between two types of renovation expenditures, and the placement of each dollar relative to that line has enormous consequences.
Repairs restore a property to its original condition. They are deductible in full in the year they are incurred. Common examples include patching a leaky roof section, fixing a broken window, repairing a damaged HVAC component, or painting over water-stained drywall. The key word is restore — you’re returning something to working condition, not improving it.
Capital improvements add value to the property, extend its useful life, or adapt it to a new use. These must be capitalized and depreciated over 27.5 years for residential property. Common examples include a new roof, a complete HVAC system replacement, a full kitchen remodel, a new electrical panel, or an addition.
The dollar difference in classification is staggering. Consider a $15,000 expense. As a repair, it’s a $15,000 deduction in the current tax year. As a capital improvement, it becomes approximately $545 per year in depreciation over 27.5 years. The classification isn’t just a tax formality — it’s a cash flow decision worth thousands in the near term.
The IRS BAR Test
The framework the IRS uses to classify expenses is known as the BAR Test, which stands for Betterment, Adaptation, and Restoration. Per the IRS Tangible Property Final Regulations, an expense is a capital improvement if it:
- Betters the property — corrects a pre-existing defect or condition, or adds capacity
- Adapts it to a new or different use
- Restores it to like-new condition after deterioration
If none of these three criteria apply, the expense is likely a deductible repair. In plain English: replacing a broken window is a repair; replacing all windows in the home is a capital improvement. Patching a section of damaged drywall is a repair; gutting and rebuilding the entire interior is a capital improvement.
For a deeper dive into this framework and its real-world investor implications, RealBooks’ guide to Repairs vs. Capital Improvements breaks down the IRS distinction with investor-specific examples and common misclassification traps. Nolo’s authoritative guide for landlords is also an excellent reference for the legal nuances.
The Fix-and-Flip Exception
For fix-and-flip investors, the tax picture is fundamentally different. Because flippers are treating properties as inventory rather than long-term held assets, renovation costs are generally classified as cost of goods sold (COGS) rather than depreciable capital improvements. This changes the entire tax treatment — COGS reduces gross income directly in the year of sale, which can be advantageous, but it also means flippers don’t benefit from depreciation, cost segregation, or bonus depreciation strategies.
BRRRR and Rental Investors: The Depreciation Opportunity
Once a BRRRR property has been refinanced and tenanted, it transitions to long-term asset status. At that point, renovation costs become capital improvements that are depreciated over time — but they also become eligible for advanced tax strategies including cost segregation and bonus depreciation. These strategies can accelerate depreciation deductions dramatically, improving near-term cash flow and tax efficiency.
RealBooks’ cost segregation tools are designed specifically for investors with significant capital improvement budgets who want to maximize the depreciation opportunity. For a foundational understanding of how this strategy works, the RealBooks Cost Segregation 101 guide is an excellent starting point.
Why Tracking Is the Foundation
Here’s the practical reality: none of this matters if you can’t document it. Your CPA cannot make the optimal classification call — repair or capital improvement, COGS or depreciation — without granular, expense-level records tagged to specific properties and projects. Without that documentation, you’re leaving the classification to guesswork, and guesswork on tax classification is expensive.
Every invoice needs a property, a project, and a category — captured in real time, not reconstructed from memory in March.
Knowing the classification framework is the intellectual foundation. But knowing it doesn’t protect you if you’re still tracking renovation invoices in a spreadsheet or a folder of emailed PDFs. Here’s where RealBooks closes the loop.
How RealBooks Tracks Renovation Costs From First Quote to Final Deduction
By this point in the guide, you understand the scope framework, the room-by-room numbers, the forces that blow budgets, and the tax classification rules that determine whether your renovation spending becomes this year’s deduction or a 27.5-year depreciation trickle. The final question is: how do you actually manage all of this across multiple projects, multiple properties, and multiple tax years without losing your mind?
The answer isn’t a better spreadsheet. Spreadsheets don’t flag overruns in real time. They don’t auto-classify invoices by IRS category. They don’t generate CPA-ready tax reports at year-end. They just sit there, waiting for you to update them — which almost never happens fast enough to matter.

Dollar Bill — Your AI Project Builder
Dollar Bill is RealBooks’ AI project management agent, and his job is to turn your renovation scope into a structured, tracked, real-time budget before the first contractor sets foot on the property.
Tell Dollar Bill about your property in plain English — the address, the square footage, the scope tier, and any specific rooms or systems you’re targeting. He builds a room-by-room project structure complete with work categories, line-item budget estimates drawn from regional labor and material cost data, and a framework for tracking actual spend against the plan as invoices come in.
As the project progresses and invoices arrive, Dollar Bill flags overruns in real time — not after the project is closed and the damage is done, but while there’s still an opportunity to tighten scope, renegotiate a line item, or make a conscious decision to absorb the variance. Contractor contacts, material specifications, and finish selections are stored per property, so every decision is documented and accessible — whether you’re on site or reviewing from your home office.
Penny — Your AI Bookkeeper
While Dollar Bill manages the project structure, Penny handles every dollar that moves through it. Every renovation invoice — snapped from a job site with your phone, forwarded from an email, or pulled automatically from a connected bank feed — is captured and categorized without manual data entry.
Penny assigns each expense to the correct property, the correct project category, and the correct IRS classification (repair or capital improvement) automatically. The expense that used to live in a folder of PDFs, or a Venmo transaction labeled “contractor — main bath,” now has a property address, a project line item, and a tax category attached to it the moment it’s captured.
Before RealBooks: renovation invoices scattered across email threads, text messages, and a notes app. Invoices categorized in bulk at year-end from faded receipts and bank statements.
After RealBooks: every dollar tracked in real time, classified correctly, and accessible in a single dashboard — organized by property, project, and category — whenever you or your CPA needs it.
Uncle Sam — Your AI Tax Strategist
Uncle Sam is where the renovation tracking pays its dividend. He monitors which renovation costs qualify for immediate deduction versus capitalization and depreciation, performs bonus depreciation and cost segregation analysis at the property level, and generates a CPA-ready tax report — exportable in one click — with total deductions, taxable income, and estimated tax savings calculated.
For investors managing portfolios across multiple entities, this becomes especially powerful. Rather than reconciling multiple sets of books at year-end, every property feeds into a single unified tax picture. RealBooks’ guide on managing finances across multiple LLCs covers this in detail for investors operating at scale.
The Integrated Picture
Penny tracks it. Dollar Bill builds it. Uncle Sam saves it. All three AI agents work together inside a single RealBooks platform — so investors get one clear financial picture across every property, every project, and every deduction.
You don’t need a bookkeeper, a project manager, and a tax strategist on separate retainers. You need a system that handles all three — automatically, in real time, from the first quote to the final deduction.

From the First Quote to the Final Deduction — A Complete Investor’s Recap
We started this guide with a $55,000 budget that became a $77,400 invoice. The investor in that story wasn’t reckless. They weren’t inexperienced. They just didn’t have a framework — for scoping, for contingency, for tracking, or for tax classification. And that absence of a framework cost them $22,000 in unanticipated spend and most of their projected profit.
The goal of this guide was to give you that framework. Let’s close the loop on what it contains:
Renovation costs hit investors differently because they’re not a lifestyle expense — they’re the mathematical foundation of deal underwriting, refinance appraisals, and rental ROI calculations. Every dollar you spend on a renovation must be justified by the numbers it generates.
The three tiers — cosmetic ($10–$25/sq ft), moderate ($25–$60/sq ft), and full gut ($60–$150+/sq ft) — give you a rapid assessment tool for evaluating deals before any contractor is involved. They are your first filter, not your final number.
Room-by-room line items turn a tier estimate into a working budget. Kitchens, bathrooms, mechanical systems, and finishes all have predictable cost ranges — use them to build a budget you can actually defend to your lender, your partner, and your own deal math.
Overruns are predictable. Hidden structural issues, scope creep, code compliance surprises, and material cost increases are not freak occurrences — they are the normal texture of renovation projects. A 10–20% contingency doesn’t assume disaster. It assumes reality.
Tax classification is where renovation tracking pays double. Repairs are deductible now. Capital improvements are depreciated over 27.5 years. Getting this wrong doesn’t just cost you money — it costs you time value of money over nearly three decades of deferred deductions.
Real-time tracking is the only form of budget protection that actually works. Discovering an overrun when the project is finished is information too late to use. Discovering it while the project is running is an opportunity to act.
From the first quote to the final deduction — your numbers should work as hard as your investments do.
Start Tracking Renovations Like a Professional
Stop tracking renovations in spreadsheets.
RealBooks connects your renovation costs directly to your tax records — every dollar you spend becomes a deduction you won’t miss. Dollar Bill builds your project budget. Penny captures every invoice. Uncle Sam makes sure it’s all optimized at year-end.
Want to see how RealBooks handles renovation budgeting for your specific portfolio? Visit realbooks.io to see how it works.
Know another investor who’s about to start a renovation? Send them this guide — it could save them more than they expect.
Ready to maximize your tax savings?
RealBooks automatically tracks expenses, manages assets, and calculates depreciation across your entire portfolio.
Start Free Trial →