How to Read a Property-Level P&L (Even If You've Never Seen One Before)

Ask most rental property owners how their portfolio is doing and they’ll tell you what’s in the bank account. Ask them how a specific property is performing — whether the duplex on Maple is actually carrying its weight or quietly dragging down everything else — and the answer gets vague.
That gap is exactly what a property-level profit and loss statement closes. It’s the single most useful report a real estate investor can read, and it’s genuinely not complicated once someone walks you through it line by line. If you’ve never looked at one, or you’ve glanced at one and skipped to the bottom number, this is the guide that makes it click.
General education, not tax or accounting advice. A P&L is a management tool — how figures are treated for tax purposes can differ. Confirm specifics with a qualified CPA.
What a P&L Actually Is
A profit and loss statement — also called an income statement — shows a property’s income and expenses over a period of time, and what’s left over after the expenses are subtracted from the income. That’s it. Money in at the top, money out in the middle, result at the bottom.
The word that matters most is property-level. A portfolio-wide P&L blends everything together into one set of numbers, which is useful for the big picture but hides the story of each individual property. A property-level P&L isolates a single address — so you can see whether that property is making money, not just whether your portfolio as a whole is.
This distinction is the whole reason the report is valuable. A portfolio that looks healthy in aggregate can easily contain one or two properties quietly losing money, subsidized by the winners. You’ll never see that in a blended view. You see it immediately in property-level P&Ls side by side.
A P&L is always tied to a time period — a month, a quarter, a year. “This property’s P&L” always means “over this specific stretch of time,” which is what lets you compare one period against another and spot trends.
Reading It From the Top Down
A property-level P&L has three parts, in order: income, expenses, and the result. Let’s walk through each.
The Income Section
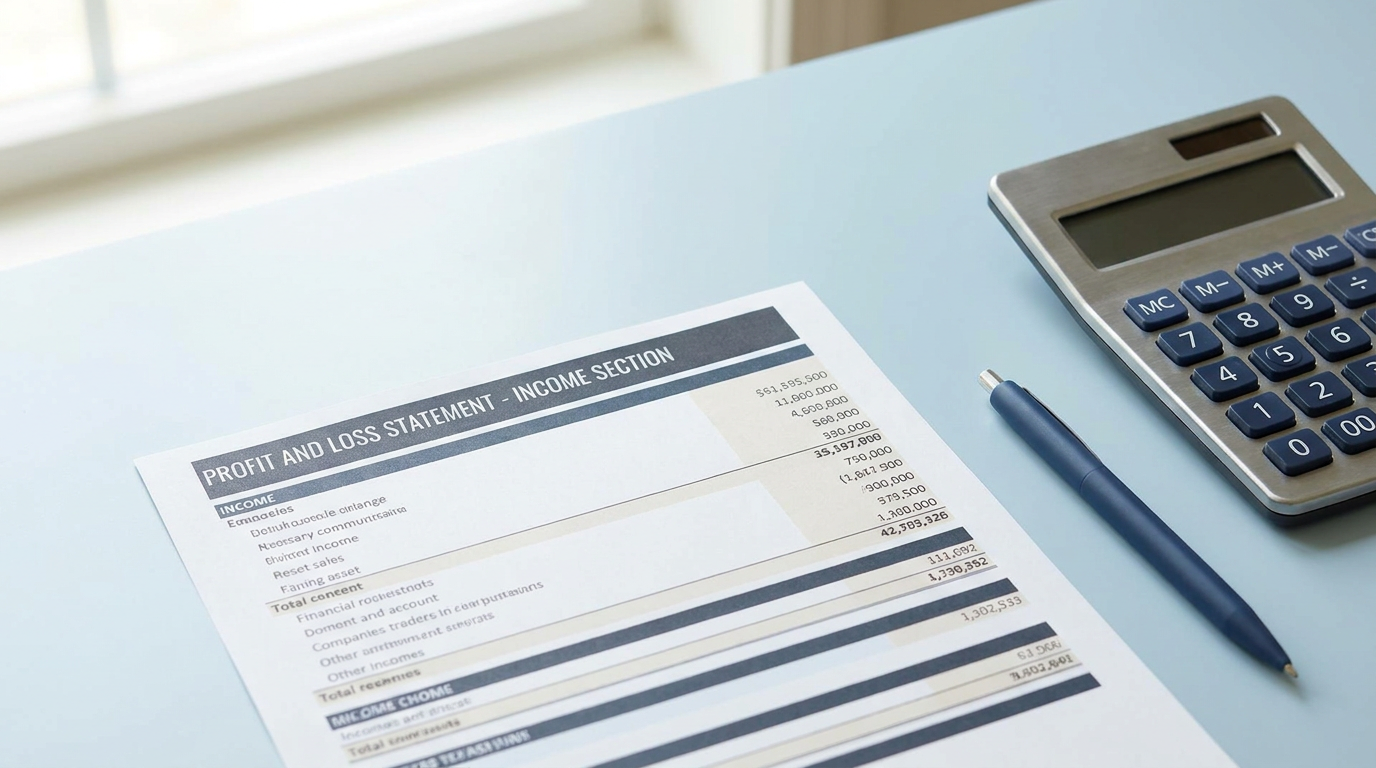
At the top is everything the property brought in. For most rentals this is straightforward, but there are usually more lines than just rent:
- Rental income — the rent collected during the period
- Late fees — if any were charged and collected
- Other income — pet fees, parking, laundry, application fees, anything else the property generated
One number to understand here is the difference between potential and actual income. Potential income is what the property would bring in at full occupancy, all rent paid, every month. Actual income is what you really collected. The gap between them — from a vacant month, or rent that came in late or not at all — is one of the first things a property-level P&L reveals. A property that’s consistently collecting less than its potential has a vacancy or collections story worth paying attention to.
The Expense Section
Below income is everything the property cost to operate over the period. This is usually the longest part of the statement, and it’s where the real insight lives. Common lines on a rental P&L:
- Mortgage interest — the interest portion of your mortgage payment (more on this in a moment)
- Property taxes
- Insurance
- Property management fees
- Repairs and maintenance
- Utilities — whichever ones you cover
- Landscaping, pest control, HOA fees
- Professional fees — bookkeeping, legal, CPA
- Depreciation — a non-cash expense we’ll cover separately below
Reading the expense section isn’t about any single number — it’s about proportion. Are your repairs running high relative to rent? Is management eating more than you expected? The expense section is where an underperforming property tells you why it’s underperforming.
The Bottom Line
After subtracting total expenses from total income, you’re left with the property’s net result for the period — a profit or a loss. This is the number everyone skips to. But as we’re about to see, the bottom line on a P&L doesn’t mean quite what most people assume it means.
Two Lines That Trip Everyone Up
Before the bottom-line number is useful, two specific lines need explaining — because they’re the ones that make a P&L confusing the first time through.
Mortgage Payments: Only the Interest Shows Up
Your mortgage payment has multiple parts — principal, interest, and often escrow for taxes and insurance. On a P&L, only the interest is an expense.
The principal portion isn’t an expense at all. It’s reducing your loan balance — money moving from one form (cash) into another (equity). It doesn’t make the property cost more; it builds your ownership. So it doesn’t belong in the expense section.
This surprises people, because they’re used to thinking of the whole monthly payment as “the cost of the mortgage.” On a P&L, it’s split: interest is a cost, principal is wealth-building that happens elsewhere. If you see only part of your mortgage payment in the expense section, that’s correct — not an error.
Depreciation: The Expense That Isn’t a Cash Expense
Depreciation is the line that makes a P&L genuinely different from your bank statement.
Depreciation is a deduction that reflects the gradual “using up” of the building over time — for residential rental property, spread across 27.5 years. It shows up as an expense on the P&L and it reduces the bottom-line number. But no cash actually left your account for it. It’s a paper expense.
This is why a property can show a loss on its P&L while depositing money in your account every month. The cash flow is positive; depreciation drags the paper result negative. Both are true at the same time — they’re just measuring different things. We’ll untangle that fully in the next section, because it’s the most important concept in reading a P&L correctly.
Related: Rental Property Depreciation Explained
The Bottom Line Isn’t Your Cash Flow
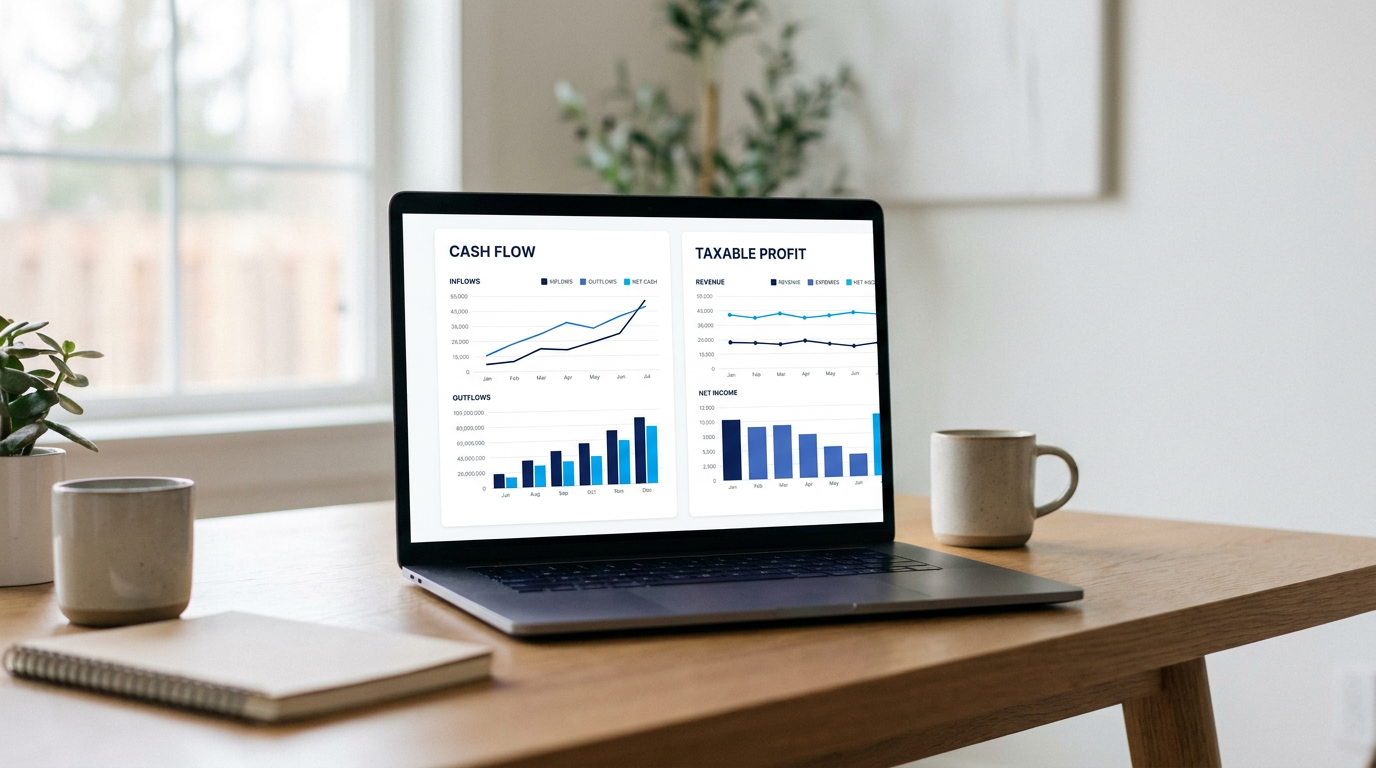
Here’s the single most important thing to understand about a property-level P&L: the bottom-line number and the cash in your pocket are two different numbers, and the difference is caused by the two lines we just covered.
Work through it in both directions:
Cash flow is what actually hit your account — rent collected, minus every dollar that actually left, including your full mortgage payment (principal and interest both).
The P&L bottom line (taxable-style profit) counts only mortgage interest as an expense, adds back the principal you paid as wealth-building rather than cost, and subtracts depreciation that no cash was spent on.
So the same property, same month, produces two different “results” depending on which question you’re asking:
- Did this property put money in my pocket? → Look at cash flow
- What’s the property’s profit for reporting purposes? → Look at the P&L bottom line
A healthy rental very often shows positive cash flow and a paper loss on the P&L at the same time — money in your account, a loss on the statement. That’s not a problem to fix. It’s frequently the whole point: real estate’s tax advantage working exactly as designed.
Reading a P&L well means knowing which question you’re answering. Investors who confuse the two make bad decisions — selling a “losing” property that’s actually cash-flowing nicely, or assuming a property is thriving because the paper profit looks good when the cash flow is thin.
Related: Passive Income Real Estate: What It Actually Means and How It’s Taxed
What a Healthy P&L Looks Like — and the Warning Signs
Once you can read the lines, you can start reading the story. Here’s what to look for.
Signs of a healthy property:
- Actual income consistently close to potential income (low vacancy, strong collections)
- Operating expenses in a reasonable proportion to income — for many residential rentals, total operating expenses land somewhere in the range of 35–50% of income, though this varies by property and market
- Repairs and maintenance that are steady and predictable rather than spiking
- Positive cash flow, even when the P&L shows a paper loss from depreciation
Warning signs worth investigating:
- A widening gap between potential and actual income — vacancy creeping up, or rent not being collected
- Repairs climbing period over period — often an early signal of a property needing capital work, or deferred maintenance catching up
- An operating expense ratio that looks implausibly low — usually means something’s missing from the statement, like a maintenance reserve or management cost, which makes the property look better than it is
- Negative cash flow — the property is costing you money out of pocket each month, which is a different and more serious situation than a paper loss
The real analytical power comes from comparison — this property this year versus last year, or this property versus another in your portfolio. A single P&L is a snapshot. P&Ls side by side are where the decisions get made: which property to raise rent on, which to refinance, which to improve, and which to let go.
Related: How to Analyze a Rental Property: The Complete Guide to Running the Numbers
Why a Good P&L Depends on Good Bookkeeping
A P&L is only as honest as the records behind it. Every insight above — the income gap, the expense proportions, the trend over time — assumes the underlying data is accurate and attributed to the right property. If a repair at one address got logged against another, or a capital improvement got buried in the repairs line, the P&L tells you a story that isn’t true.
This is where property-level P&Ls become genuinely difficult in generic accounting tools. If expenses aren’t tagged to specific properties as they happen, producing a clean property-level P&L means untangling a year of blended transactions after the fact — which is exactly when accuracy breaks down.
Penny, RealBooks’ AI bookkeeper, connects to your accounts and categorizes every transaction to the correct property and expense category as they post — so the income and expense lines on your P&L are accurate and attributed in real time, not reconstructed later.
Dollar Bill tracks cost basis and capital improvements, keeping the depreciation line on your P&L grounded in accurate numbers and ensuring improvements don’t get miscategorized as repairs.
Uncle Sam maintains the depreciation schedule and generates property-level, portfolio-level, and tax-ready reports on demand — so you can pull a clean P&L for any property, any period, whenever you want to read one.
For investors across multiple properties and entities, each keeps its own books with a consolidated view, which is what makes the side-by-side comparisons above possible at all.
RealBooks organizes your records so your P&Ls are accurate and available. It doesn’t provide tax advice — that’s your CPA’s role. What clean books change is whether your P&L is a reliable decision-making tool or a rough guess.
Related: Real Estate Bookkeeping: The Complete Guide
The Takeaway
A property-level P&L isn’t an accounting formality — it’s the clearest window you have into how each individual property is actually performing. Read from the top down, it tells you what came in, what it cost, and what’s left. Read carefully, it tells you why a property is doing well or poorly, and whether the number you’re looking at means cash in your pocket or a paper result on a tax form.
The two concepts that unlock it: only mortgage interest is an expense, and depreciation is a real expense line that cost you no cash. Hold those two in mind, know whether you’re asking about cash flow or paper profit, and a P&L stops being intimidating and starts being the most useful report you own.
Your numbers should work as hard as your investments do.
Pull a clean P&L for any property, any period — on demand.
Start a Free Trial → · See How It Works →
This article is for general educational purposes and reflects general investor guidance. It does not constitute tax, legal, or accounting advice. Financial statement treatment and tax treatment can differ. Consult a qualified CPA regarding your specific situation.
Ready to maximize your tax savings?
RealBooks automatically tracks expenses, manages assets, and calculates depreciation across your entire portfolio.
Start Free Trial →