Cash Flow vs. Profit vs. Equity: The Three Numbers Every Rental Investor Confuses

Picture an investor at the kitchen table on a quiet Sunday morning. The coffee is still hot, the laptop is open, and the tax return for a rental property just loaded on the screen. The bottom line says the property lost money. A loss. On a house that pays its own mortgage every month and has never missed a beat. The investor stares at it, feels a little sick, and starts wondering whether it is time to sell.
Then a strange thing happens. That same investor pulls up a second number later that week, almost by accident, and finds out the property added about $18,000 to their net worth over the same twelve months. Not a loss. A gain. A big one.
Both numbers are true. That is the part that trips people up. A rental property does not have one score. It has three, and they answer three completely different questions. The first is cash flow, the money that actually lands in your account. The second is profit, the number the IRS taxes you on. The third is equity, the portion of the property you truly own. Most investors treat these as one thing, and that single mistake quietly drives some of the worst decisions in real estate.
Here is the promise for the next ten minutes. By the end of this piece you will be able to read cash flow vs profit vs equity at a glance, know which one to watch and when, and never again panic over a property that “lost money on paper” while it was making you richer. We will use real dollar figures the whole way, because the numbers are the entire point.
Three Numbers, Three Different Questions
Before any math, you need a fast mental model. The cleanest way to understand these three metrics is to stop thinking of them as numbers and start thinking of them as answers. Each one responds to a different question, and if you ask the wrong number the wrong question, you will always get a misleading reply.
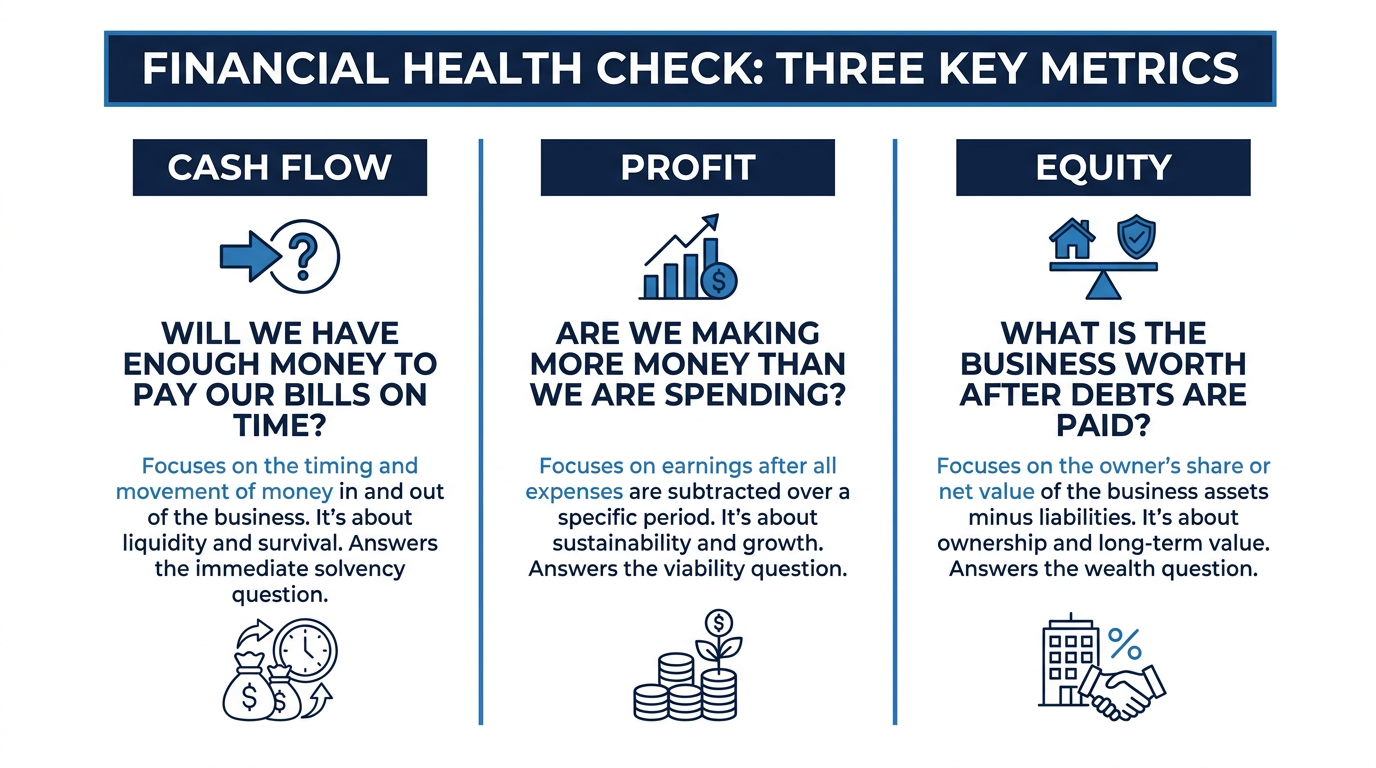
Cash flow answers one thing: Did money actually land in my account this month? It is the most physical of the three. You can feel it. It is the difference between the rent that came in and every dollar that went back out, including the full mortgage payment.
Profit answers something else entirely: What will the IRS tax me on? This is net income for tax purposes, and it follows a rulebook that has very little interest in what your bank balance looks like. Some real costs are invisible to it. Some deductions represent money that never left your pocket.
Equity answers a third question: How much of this property do I actually own? It ignores months and tax years and looks instead at what you would keep if you sold today and paid off the loan.
The important point, the one that unlocks everything, is that these three can move in opposite directions in the exact same year. You can have positive cash flow, a reported loss on your taxes, and rising equity all at once. Nothing is broken when that happens. It is normal. It is, in fact, what a well-structured rental often does.
Cash flow is what you can spend. Profit is what you’re taxed on. Equity is what you own. They are not three views of the same number. They are three different numbers.
The general accounting split between cash in the bank and reported earnings is not unique to real estate. As Harvard Business School Online explains, cash flow and profit measure fundamentally different things, and a business can show a profit while running low on cash, or sit on healthy cash while reporting a loss. Rentals just make this gap unusually wide, because of two quirks we will get to shortly.
Confusing the three leads to two classic mistakes. The first is thinking a healthy property is failing, because the tax return shows red ink. The second is pulling too much cash out because the property “showed a profit,” only to come up short when a real bill arrives. Both are expensive. Both are avoidable. Both come from asking one number a question it was never built to answer.
Here is a simple way to keep them straight.
The rest of this article takes each number apart with real figures, then shows you how to see all three together without a shoebox of receipts or a January scramble. We will start with the one you feel first, the one that hits your bank account.
Cash Flow: The Money That Actually Hits Your Account
Cash flow is the number investors trust most, and for good reason. It is the one you can verify by logging into your bank. It does not care about tax rules or appraisals or anything theoretical. It simply asks whether more money came in than went out, and by how much.
The definition is straightforward. Cash flow is all cash in, minus all cash out. Cash in means rent and any fees you collect. Cash out means every dollar that leaves your account to keep the property running: the mortgage principal and interest, property taxes, insurance, repairs, management fees, and any capital expenses you actually pay in cash during the period. That framing, income minus total expenses including your full debt service, is the one used across real estate finance education, including this breakdown of rental property cash flow.
Let’s run a real example. Take a single-family rental that brings in solid, mid-market rent.
- Monthly rent: $2,200
- Mortgage principal and interest: $1,050
- Property tax and insurance (held in escrow): $450
- Property management at 8 percent: $176
- Repairs and maintenance reserve: $150
Add up the outflows and you get $1,826. Subtract that from $2,200 and you land on $374 per month in cash flow. Over a full year, that is about $4,488 that genuinely stacks up in your account. Not theoretical. Spendable.
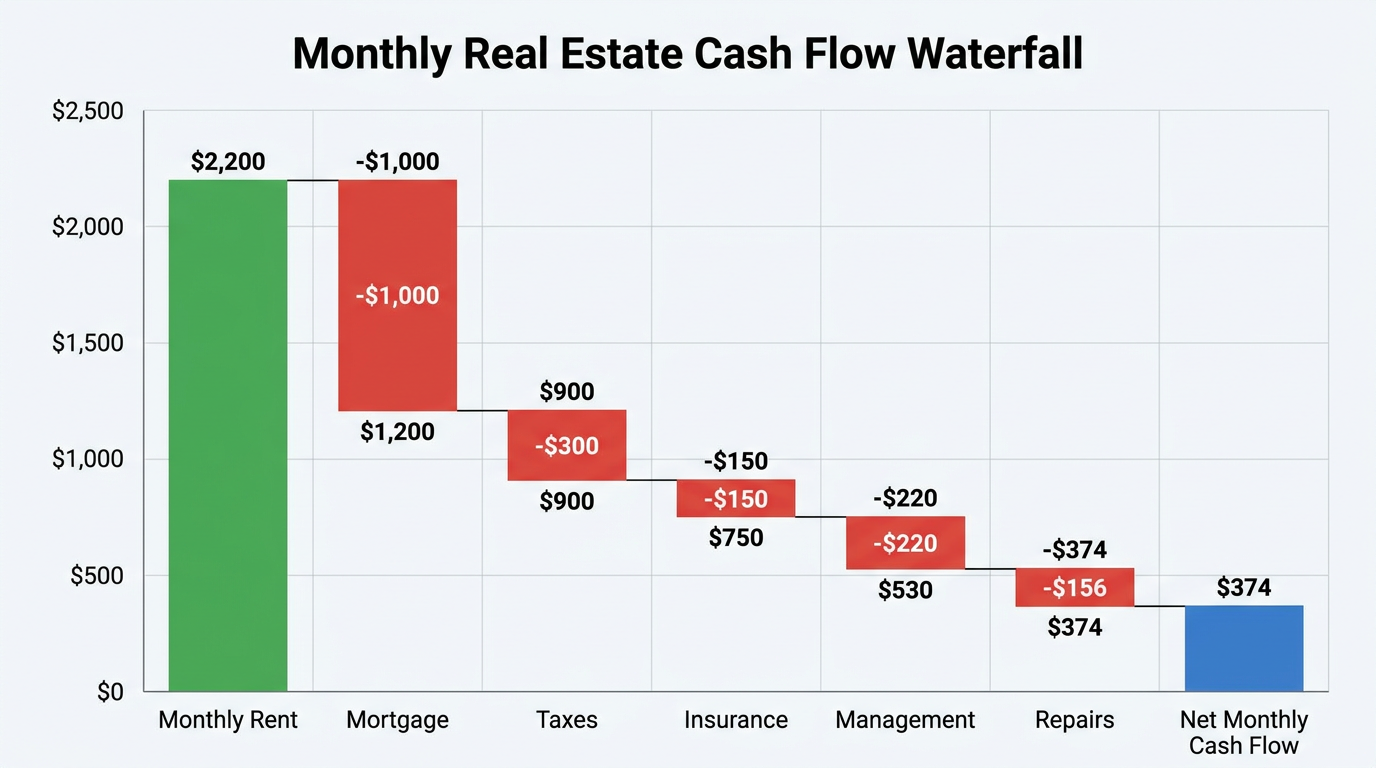
Now notice one detail in that math, because it becomes the hinge of the entire next section. The mortgage payment of $1,050 includes both principal and interest. All of it left your account, so all of it reduced your cash flow. That feels obvious. Money out is money out.
But here is the quirk. Only the interest portion is treated as an expense when the IRS calculates your profit. The principal portion, the part that pays down your loan, is not an expense at all. It reduces what you owe, which means it is really a transfer from one pocket (cash) to another pocket (equity). Cash flow feels the whole payment. Profit only feels part of it. Hold on to that, because it is about to flip your tax return upside down in the best possible way.
When should you watch cash flow most closely? Whenever solvency is in question. During a renovation, cash goes out fast and rent often stops coming in, so a property that cash flows beautifully when stabilized can bleed for months mid-project. During a vacancy, your outflows continue while the top line goes to zero. And during a rate change on an adjustable loan, your single largest outflow can jump overnight. Cash flow is the number that keeps you solvent, so it is the one you monitor when the margin for error is thin.
The trouble is that cash flow is deceptively easy to misread. Rent might hit one account, the mortgage might draft from another, repairs might go on a personal card you keep meaning to separate, and the management statement might live in an email folder you open once a quarter. When a single property’s expenses are scattered across three bank accounts and two spreadsheets, the “simple” number is anything but. You think you are cash-flow positive. You hope you are. You are not entirely sure until something forces you to add it all up.
That uncertainty is bad enough on its own. It gets worse the moment tax rules enter the picture, because the same property can show a completely different result. That different result is called profit, and it is where almost everyone gets confused.
Profit: The Number the IRS Actually Taxes
If cash flow is the number you feel, profit is the number you file. It is your taxable net income, and it is the single most misunderstood figure in rental investing. It deserves the most room here, so we will take it slowly and let the math do the talking.
Start with the definition. For tax purposes, your rental profit is rental income, minus operating expenses, minus mortgage interest, minus depreciation. Read that list again and notice two words that are missing and one word that is new. The missing words are “mortgage principal.” The new word is “depreciation.” Those two items are exactly what split profit away from cash flow, and once you see how, you will never confuse the two again.
The first split: principal paydown
We already met this one. Every month, part of your mortgage payment reduces the loan balance. That principal is real cash leaving your account, so it lowers your cash flow. But the IRS does not let you deduct principal, because you are not spending it, you are repaying borrowed money and building ownership. So principal lowers cash flow but does not lower taxable profit. Your tax bill ignores a real expense you paid.
The second split: depreciation
This one runs the opposite direction, and it is the star of the show. Depreciation is a deduction the IRS grants to reflect the wear and aging of a building over time. The key word is deduction. No money leaves your account. You do not write a check for depreciation. Yet it reduces your taxable income every single year. So depreciation lowers taxable profit without touching cash flow. The tax return subtracts an expense you never actually paid.
Here is how residential rental depreciation works in plain terms. You cannot depreciate land, only the building. You take the building portion of your cost (your “basis”) and write it off over 27.5 years using the straight-line method under what the IRS calls MACRS General Depreciation System. This is spelled out in IRS Publication 527, Residential Rental Property, the authoritative source on reporting rental income, expenses, and depreciation.
Let’s put a number on it. Say the building portion of your property is worth $330,000 (after carving out the land). Divide that by 27.5 and you get $12,000 per year in depreciation. Twelve thousand dollars of deduction, every year, for which you spend nothing.
Watching the same property diverge
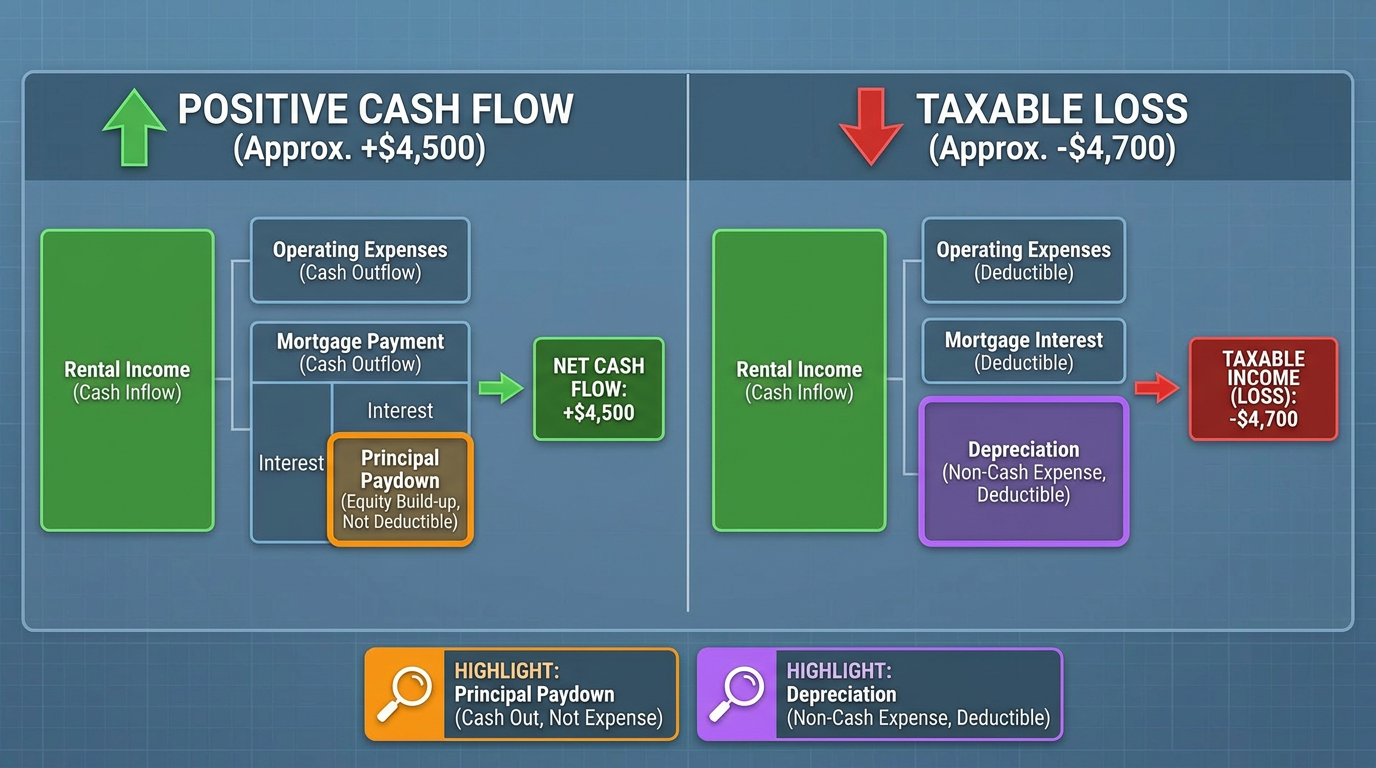
Now carry our single-family rental from the last section into a taxable profit calculation and watch what happens.
- Annual rent: $26,400
- Operating expenses (taxes, insurance, management, repairs): about $9,300
- Mortgage interest only (not principal): about $9,800
- Depreciation: $12,000
Add the three deductions together and you get $31,100. Subtract that from $26,400 of rent and you land on a paper loss of roughly $4,700.
Sit with that for a second. The very same property we just proved puts about $4,500 of real cash into your account over the year also reports a $4,700 loss to the IRS. Positive cash flow and negative taxable profit, same property, same twelve months. This is the single idea the entire article is built around, so here it is as plainly as it can be stated.
Depreciation lowers what you’re taxed on without touching what’s in your account.
Your money went up. Your tax bill went down. Nothing was fraudulent, nothing was aggressive, and nothing was unusual. This is simply how the two numbers are designed to behave.
One honest caveat before we move on. A paper loss is only useful if you can actually use it, and the rules around that are genuinely complicated. Passive activity loss limitations can suspend a rental loss if your income is above certain thresholds and you do not qualify for an exception, which means the loss may carry forward rather than offset your other income this year. There are real estate professional rules and short-term rental nuances that can change the answer entirely. This is exactly where you want to talk to your CPA about your own situation. The goal here is to help you see the number, not to tell you how it lands on your personal return.
Cash flow and profit both look at a single year. They are snapshots. But there is a third number that does not care about any single year at all, one that compounds quietly underneath the other two whether you are watching or not. That number is equity.
Equity: The Wealth You Build Without Seeing It
If cash flow is what you feel and profit is what you file, equity is what you forget you have. It builds in the background, it rarely shows up in your bank account, and it is often the largest number of the three by a wide margin. It is also the one that explains why a property can “underperform” on cash and still make you meaningfully richer.
The definition is clean. Equity is your property’s current market value minus the loan balance. It is the slice of the asset you actually own, free and clear. If your house is worth $300,000 and you owe $240,000 on it, your equity is $60,000. Pay down the loan or watch the value climb, and that slice grows.
There are exactly two engines that build equity over time, and as Investopedia lays out in its explainer on home equity, they are principal paydown and appreciation.
Engine one: principal paydown
Remember the villain from the profit section, the principal portion of your mortgage payment that hurt your cash flow and gave you no tax deduction? Here it is again, except now it is the hero. Every dollar of principal you repay reduces your loan balance by a dollar, which increases your equity by a dollar. The cash you “lost” to principal did not vanish. It changed form. It moved from your checking account onto your balance sheet. Same dollars, different scoreboard.
Engine two: appreciation
The second engine is the property’s market value rising over time. You do nothing for this one except own the asset. When the neighborhood improves, when rents rise, when the market lifts, your value climbs and your equity climbs with it. It is the engine you control the least and benefit from the most.
Watching equity grow on the same property
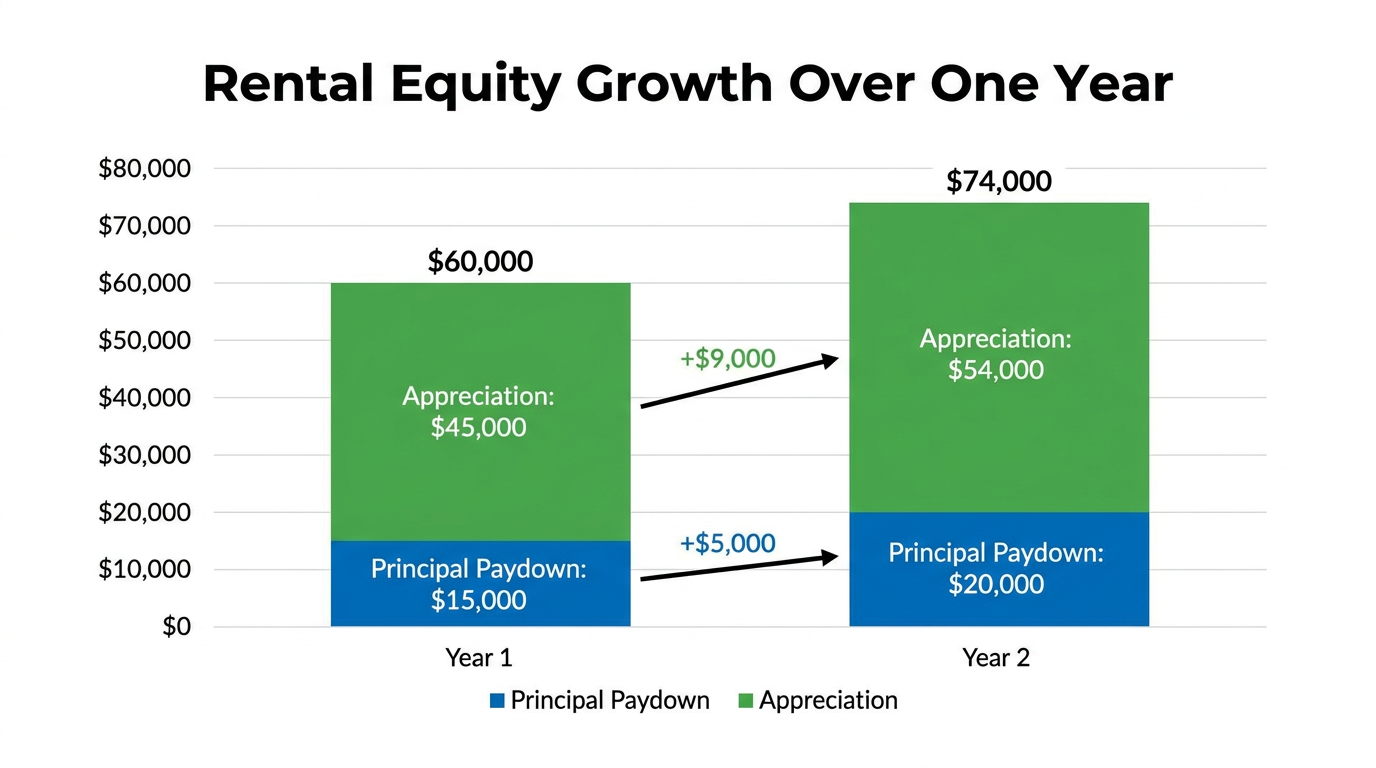
Let’s run the numbers on our familiar rental. At the start of the year it is worth $300,000 with a $240,000 loan, so your equity is $60,000.
Over twelve months, two things happen. First, your mortgage payments chip away at the balance, paying down roughly $5,000 of principal. Second, the property appreciates a modest 3 percent, which on a $300,000 home is about $9,000.
Add them together. Five thousand from principal, nine thousand from appreciation, for a total of $14,000. Your equity climbs from $60,000 to about $74,000 over the year. That is $14,000 of real net worth you built without ever seeing a dime of it in your bank account. Combine it with the $4,500 of cash flow and you are looking at a property that quietly delivered roughly $18,500 of total return in a year it reported a loss. That is the $18,000 surprise from the opening scene, and now you know exactly where it came from.
Here is the connection worth tattooing on your brain. The principal paydown that hurt your cash flow and did nothing for your taxable profit became equity. The same $5,000 showed up as a negative on one scoreboard, a non-event on another, and a gain on the third. One dollar amount, three different stories, depending on which question you are asking.
There is one honest limit to equity. It is real net worth, but it is illiquid. You cannot pay for a roof repair with equity. You cannot buy groceries with it. To access it you have to sell or refinance, and both take time and cost money. That is precisely why you still watch cash flow month to month even while equity does the quiet, heavy lifting of building your wealth. Equity makes you rich on paper. Cash flow keeps you solvent in practice. You need both, and you need to read them separately.
Now that all three numbers are defined, the interesting part begins. What happens when investors mix them up? The answer is that they make specific, costly decisions, and the mistakes are worth studying because you will almost certainly recognize one of them.
When Investors Confuse the Three (And What It Costs)
Definitions are easy to nod along to and easy to forget. Decisions are where the confusion actually hurts. So let’s turn the three numbers into four real mistakes, each with a price tag. See if you spot yourself in any of them.
Mistake 1: Selling a “loser” that was quietly winning
This is the one from our opening scene, and it is the most expensive of the bunch. An investor opens the tax return, sees a $4,700 loss, decides the property is a dog, and sells.
Walk through what they actually gave up. That “losing” property was generating about $4,500 a year in cash flow and building roughly $14,000 a year in equity. That is close to $18,500 of annual return on a single house. Sell it, and you do not just stop the loss (which was never real cash in the first place), you also stop the cash flow, freeze the equity growth, trigger capital gains and depreciation recapture, and pay a realtor 5 or 6 percent of the sale price on the way out the door. A decision meant to cut a loss can easily cost tens of thousands of dollars. The property was not a loser. The reader of the number was.
Mistake 2: Over-distributing on “profit”
Now flip it. A small multifamily shows strong accounting profit on the books, so the owner feels flush and pulls a big distribution to themselves. The trouble is that accounting profit is not the same as cash in the account. If much of that reported profit was tied up in non-cash factors, or if principal paydown and capital reserves were quietly eating the real cash, the owner has just distributed money the property needed. Then the water heater fails, a tenant turns over, and there is no cash to cover the capex bill. The number said profit. The bank account said otherwise. Spending profit as if it were cash is how otherwise healthy portfolios end up borrowing to fund emergencies.
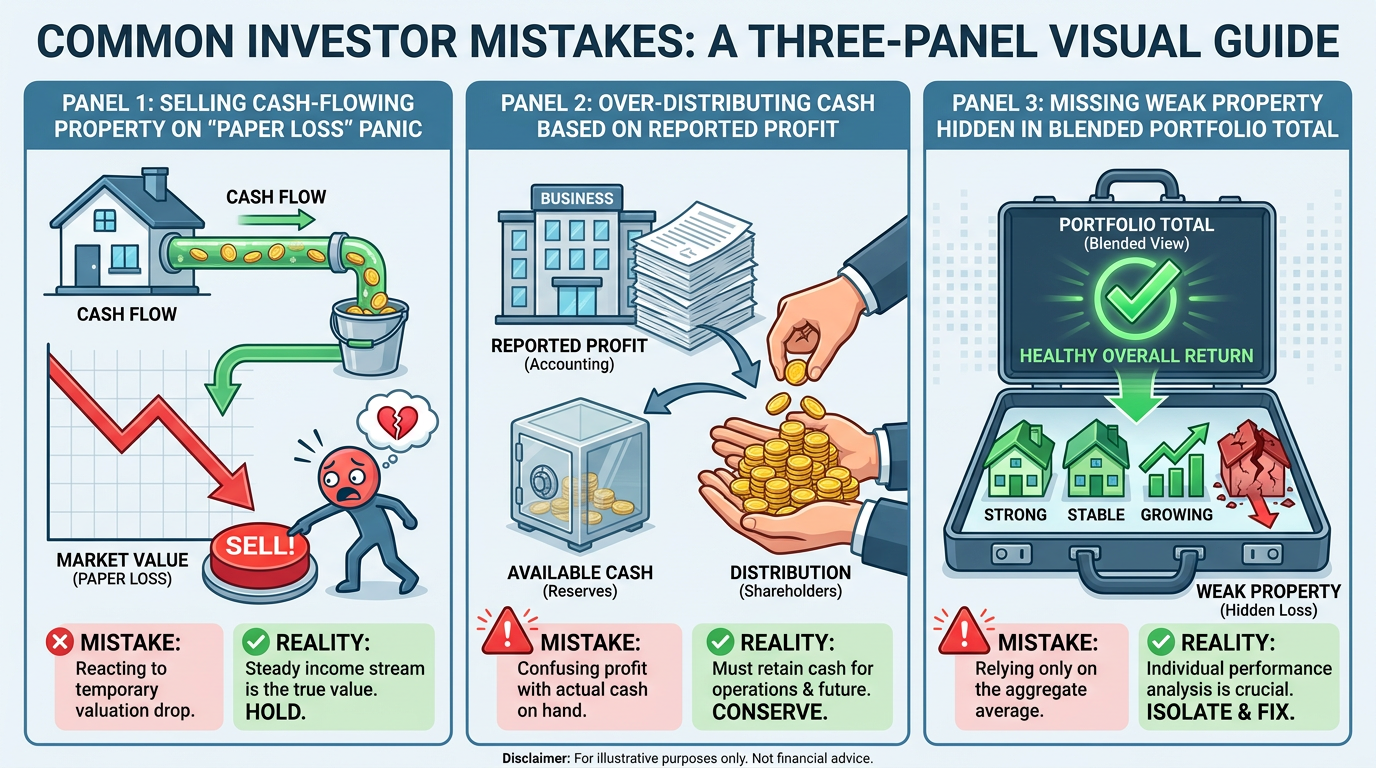
Mistake 3: Judging the whole portfolio by one blended number
This one hides in plain sight. You own five properties, and you track them all in a single spreadsheet with one grand total at the bottom. The total looks fine, so you relax. But a blended number is a disguise. A strong performer throwing off $600 a month can completely mask a property bleeding $400 a month, and the combined total still looks positive. You never see the bleeder, so you never fix it, refinance it, or sell it. Months pass. The weak property keeps draining the strong one. The pain point here is structural: when your data lives in too many places and only rolls up to one blended figure, you lose the property-level view that would have shown you the problem on day one.
Mistake 4: Treating profit as a once-a-year surprise
The fourth mistake is about timing, not math. Most investors meet their profit number exactly once a year, in the spring, when the return is already done and every decision that could have changed it is already in the past. By then, it is too late to accelerate a deduction, time a repair, run a cost segregation study, or adjust a distribution. Tax preparation works far better as a year-round habit than a year-end excavation. When you can watch your taxable position all year, the number stops being a surprise and starts being a tool. (For more practical, plain-English tax and bookkeeping tips written for investors, the RealBooks blog is a good place to keep learning.)
Every one of these four mistakes shares a single root cause. Not bad math. Not bad judgment. Just not seeing the numbers clearly, per property, in time to act. Fix the visibility problem and all four mistakes mostly disappear on their own. So let’s close by looking at what it actually takes to see all three numbers in one place, all year.
Seeing All Three at Once: Clean Records, Per Property, All Year
Here is the uncomfortable truth underneath this entire article. You cannot compare three numbers you cannot see. And for most investors, the three numbers live in three different places, each telling a partial story at a different time.
Your spreadsheet shows one view, usually a rough cash picture that is only as accurate as your last update. Your bank accounts show another, scattered across checking, escrow, and a credit card or two. Your tax return shows a third, and it arrives months after the year is over, long past the point where you could have done anything about it. Three sources, three timelines, zero alignment. No wonder people confuse cash flow, profit, and equity. They are rarely looking at them side by side.
So what does it actually take to fix that? Clean records are not a vague aspiration. They have specific requirements:
- Every expense tied to the right property. Not a lump category, not a personal card you will “sort out later,” but each dollar assigned to the asset it belongs to.
- Principal split from interest correctly. This is the hinge of the whole piece. If your books treat the full mortgage payment as one expense, your profit number is wrong and your equity picture is invisible.
- A depreciation schedule tracked per asset. Your $12,000-a-year deduction only shows up if something is actually running it, property by property, year after year.
- A real-time view instead of a January reconstruction. The data has to be current enough that it informs decisions while you can still make them.
When those four things are in place, something clicks. A property-level profit and loss statement sitting next to a running depreciation schedule lets cash flow, taxable profit, and equity live in the same view at the same time. You stop guessing which number to trust because you can read all three. The paper loss stops being scary because you can see the cash and the equity right beside it. The portfolio stops hiding its bleeder because each property stands on its own.
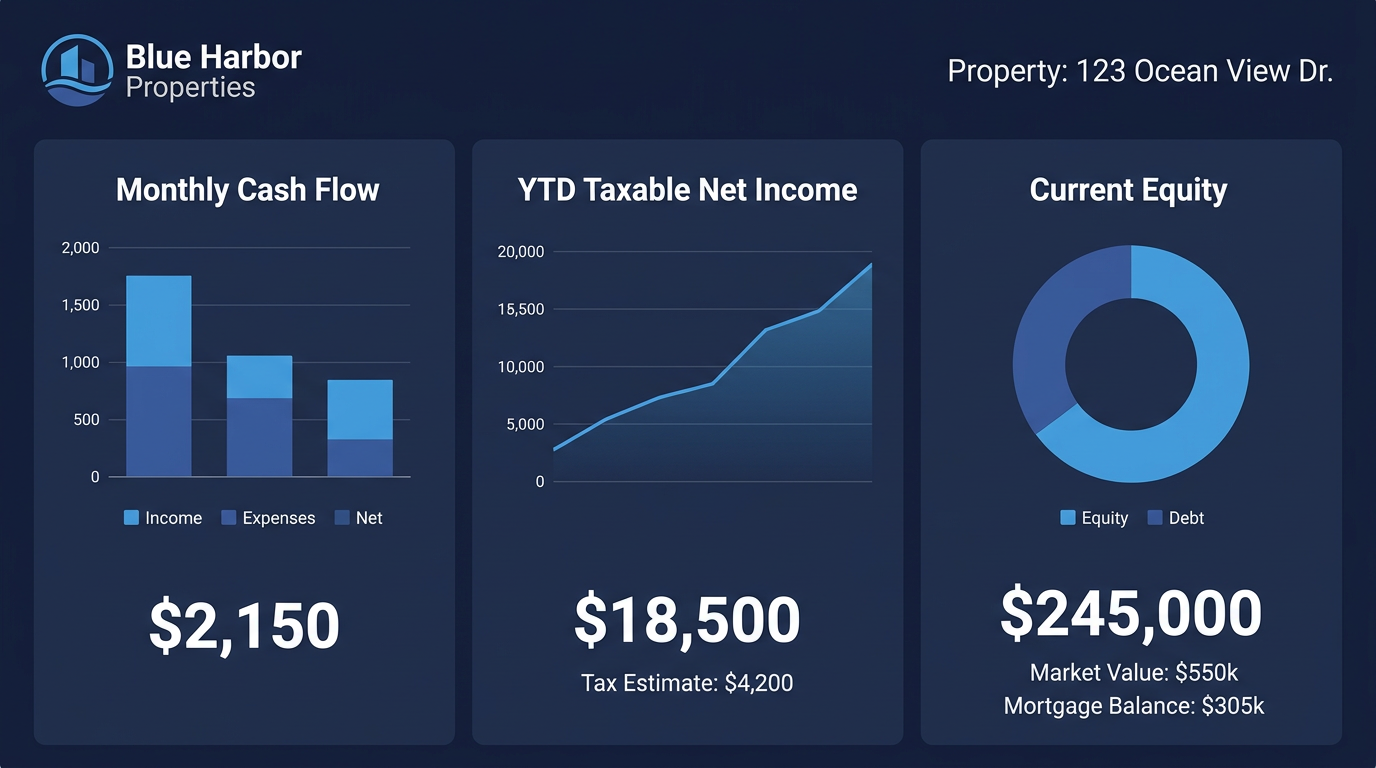
This is the exact problem RealBooks was built to solve. Penny, the AI bookkeeper, ties each transaction to the right property and the right category as it comes in, so your expenses stop scattering across accounts and spreadsheets. That is the foundation under expense management, and it is what makes a true property-level view possible in the first place.
From there, Uncle Sam, the AI tax strategist (coming soon), will keep your depreciation schedules and tax-ready numbers current, so your taxable profit will be something you can watch all year rather than discover in April. Because the ledger classifies and reconciles continuously, your figures update as the year goes instead of waiting for a year-end close. That is the whole idea behind the Autonomous General Ledger: books that are always current, so the three numbers are always readable.
And if you want to push on that depreciation figure from the profit section, cost segregation is the tool that accelerates it. Instead of spreading the whole building over 27.5 years in equal slices, cost segregation reclassifies portions of the property into shorter 5- and 15-year schedules, pulling more deduction into the early years. That can turn a modest paper loss into a larger one, which (subject to those passive activity rules your CPA will walk you through) can be genuinely valuable. It is the same methodology that normally costs thousands in an engineering study, done automatically.
The point is not to sell you software in the middle of a lesson about numbers. The point is simpler than that. Your numbers should work as hard as your properties do. When they live in one place, per property, updated as the year goes, you stop guessing and start seeing. That is the whole game.
Let’s pull the three threads together.

Conclusion: Reading Cash Flow, Profit, and Equity Together
Here is everything, in one breath. Cash flow is what you can spend. Profit is what you’re taxed on. Equity is what you own. Three numbers, three questions, and no obligation to agree with each other in any given year.
Go back to the investor at the kitchen table. The property that “lost money on paper” put about $4,500 of real cash in the account, built roughly $14,000 of equity, and handed over a $4,700 deduction that lowered the tax bill, all in the same twelve months. Nothing was broken. The only thing that ever went wrong was reading one number and assuming it told the whole story.
That is the skill worth keeping. When you can read all three together, a paper loss stops being a reason to panic and becomes a line item you understand. A strong profit stops being a license to over-distribute. A blended portfolio total stops hiding your weakest property. You make calls based on what is actually happening, not on whichever number happened to catch your eye first.
And that clarity does not come from being smarter than everyone else. It comes from clean records, kept all year, per property, with principal split from interest and depreciation running quietly in the background. Get the visibility right and the good decisions follow almost on their own.
See All Three in One Place
You don’t need to track three separate numbers in three separate places. When your expenses are tied to the right property and your depreciation runs in the background, cash flow, profit, and equity sit in one view all year. See how RealBooks keeps all three clear at realbooks.io.
And if this cleared something up for you, share it with an investor who just panicked over a paper loss. They will thank you.
Ready to maximize your tax savings?
RealBooks automatically tracks expenses, manages assets, and calculates depreciation across your entire portfolio.
Start Free Trial →