Cap Rate vs. Cash-on-Cash Return: The Two Numbers Every Real Estate Investor Must Understand

Two numbers. Two very different stories. If you’re only looking at one, you’re missing half the picture.
If you’ve spent any time analyzing rental properties, you’ve encountered cap rate and cash-on-cash return. You may have even used both. But here’s the thing — these two metrics are among the most frequently cited and the most frequently misunderstood numbers in real estate investing. Investors mix them up, swap them out, or worse, rely on just one while ignoring the other entirely. That’s a costly mistake.
The direct answer: Cap rate measures a property’s income potential relative to its value — independent of how it’s financed. Cash-on-cash return measures the actual cash yield on the money you personally invested, including the impact of your mortgage. Both metrics matter. Neither one alone tells the full story.
This guide is built for investors who want to move beyond surface-level definitions. You’ll get precise formulas, real worked examples using the same property, a clear breakdown of when each metric applies, the most common mistakes investors make, and a practical framework for using both together. Along the way, you’ll see why the accuracy of these numbers depends entirely on the quality of the financial data behind them — something that matters more the larger your portfolio grows.
Let’s start at the beginning, with the metric most investors encounter first: cap rate.
Unpacking Cap Rate: Definition, Formula, and What It Really Tells You
Cap rate — short for capitalization rate — is one of the most widely used tools in real estate investing, and for good reason. It gives you a clean, financing-free snapshot of a property’s income-generating power relative to its value. Whether you’re comparing two duplexes in the same zip code or trying to understand whether a seller’s asking price makes sense for the income the property produces, cap rate cuts through the noise and delivers a single, comparable number.
Here’s the formal definition: cap rate is the rate of return on a property based on the income it generates, assuming you purchased it entirely with cash. No mortgage. No loan. No financing of any kind. That assumption is deliberate — and it’s what makes cap rate so useful as a comparison tool.
The Cap Rate Formula
The formula is straightforward:
Cap Rate = Net Operating Income (NOI) ÷ Current Market Value (or Purchase Price) × 100
The key variable here — and the one that trips up many investors — is Net Operating Income (NOI). NOI is not gross rent. It’s gross rental income minus all operating expenses, not including mortgage payments. Those operating expenses include property taxes, insurance, routine maintenance, property management fees, and a realistic vacancy allowance. The mortgage is intentionally excluded because cap rate is designed to evaluate the property itself, not your specific financing arrangement.
Let’s make that concrete with a worked example.
Cap Rate in Action: A Worked Example
Imagine you’re evaluating a single-family rental property with the following profile:
- Purchase price: $500,000
- Annual gross rent: $48,000
- Annual operating expenses (taxes, insurance, maintenance, management, vacancy allowance): $18,000
- Net Operating Income (NOI): $48,000 − $18,000 = $30,000
Plug that into the formula:
Cap Rate = $30,000 ÷ $500,000 × 100 = 6%
A 6% cap rate. But what does that number actually mean?
Think of it this way: for every dollar of property value, the property generates 6 cents of net income per year. It’s an efficiency ratio — a measure of how hard the asset is working on its own, independent of how you financed it. According to Investopedia’s breakdown of capitalization rate, cap rate is also the primary tool appraisers and investors use to estimate property value from a known NOI — making it foundational to how commercial and investment real estate is priced.
What Does a “Good” Cap Rate Look Like?
Cap rate benchmarks vary significantly by market, asset class, and risk profile. As of mid-2026, typical ranges look like this:
- Class A multifamily in major metros: 4–5.5%
- Class B multifamily: 5.5–7%
- Single-family rentals in strong markets: 3–5%
- Single-family rentals in secondary markets: 5–7%
- Small commercial / retail: 6–8%
A lower cap rate generally indicates a more competitive, lower-risk market where properties command premium prices relative to their income — think core urban markets in high-demand cities. A higher cap rate often signals a less competitive or higher-risk market — potentially higher vacancy, weaker demand, or greater asset-level uncertainty.
Critically: a higher cap rate is not automatically better. It’s a signal, not a verdict. You have to understand what’s driving it.
Cap Rate as a Market Tool
One of the most powerful applications of cap rate is in property valuation. If you know the NOI a property generates and you know the prevailing cap rate in that market, you can estimate what the property should be worth. Conversely, if you know the asking price and the NOI, you can calculate whether the implied cap rate aligns with market norms — or whether a seller is pricing in optimistic assumptions.
Cap rate is the language investors and appraisers use to benchmark properties against each other. It strips away the noise of individual financing situations and creates a level playing field for comparison.
There’s one thing cap rate intentionally leaves out, though — and that’s exactly where the second metric picks up the story.
Cash-on-Cash Return: The Metric That Changes When You Borrow
The moment you bring a mortgage into the picture, cap rate stops telling the whole story. That’s not a flaw — it’s by design. Cap rate evaluates the property. Cash-on-cash return evaluates your investment in that property, accounting for how you actually paid for it.
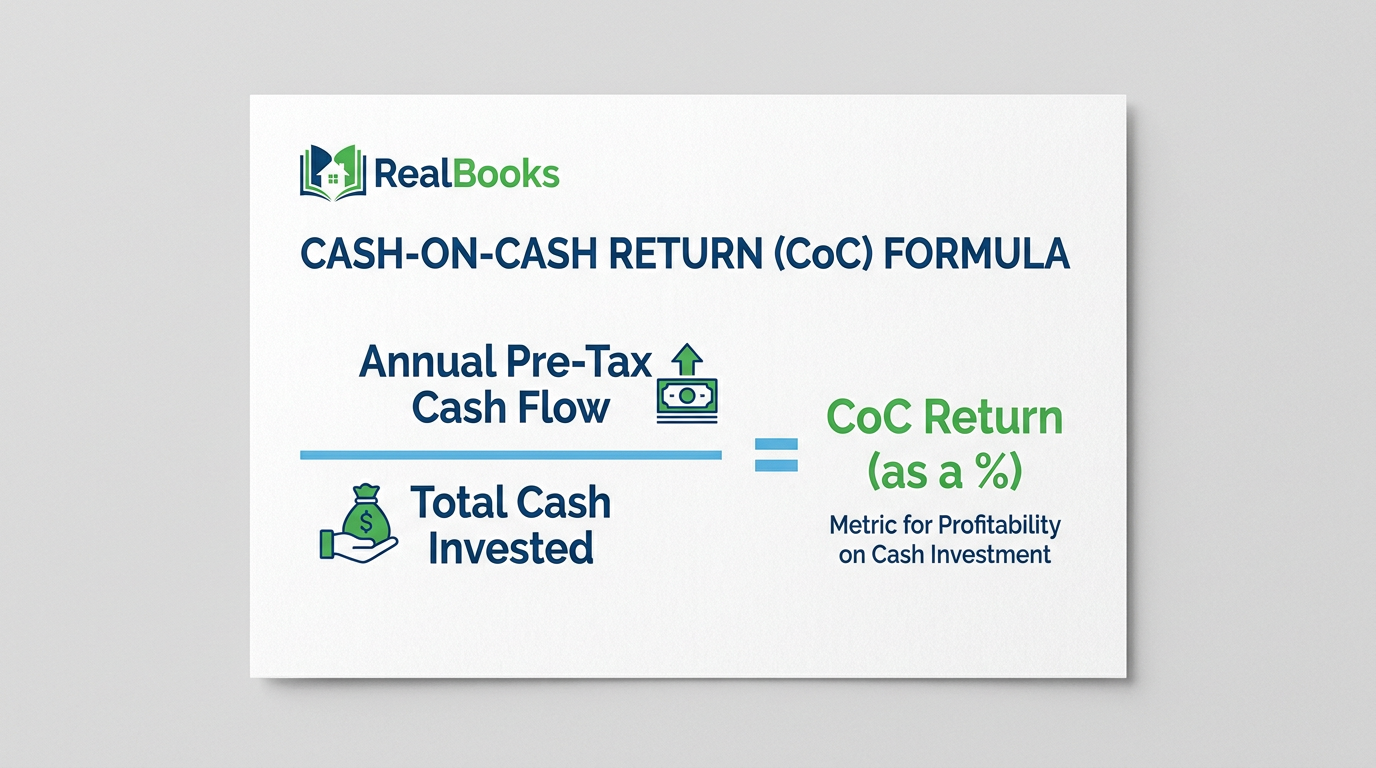
Cash-on-cash return (CoC) is the annual pre-tax cash flow you receive as a percentage of the actual cash you personally invested — your down payment, closing costs, and any upfront capital you put into the deal. It answers the question cap rate can’t: “Given what I personally put in, what am I actually getting back each year?”
The Cash-on-Cash Return Formula
Cash-on-Cash Return = Annual Pre-Tax Cash Flow ÷ Total Cash Invested × 100
Two key definitions to nail down before running any numbers:
Annual pre-tax cash flow is your NOI minus your annual mortgage payments (principal and interest). This is the real cash that flows into your account after the bank has taken its share. It’s what you actually live on — or reinvest.
Total cash invested is your genuine out-of-pocket commitment to get into the deal: down payment, closing costs, initial repairs, reserves — everything you wrote a check for before collecting a single dollar of rent.
Cash-on-Cash Return in Action: The Same Property, A Very Different Story
Let’s use the exact same $500,000 property from the cap rate example — same purchase price, same NOI of $30,000, same 6% cap rate. The only thing that changes is how you’re financing it.
- Down payment (25%): $125,000
- Closing costs: $8,000
- Total cash invested: $133,000
- Loan amount: $375,000
- Loan terms: 30-year fixed at 7.0% (reflecting current 2026 investment property mortgage rates)
- Annual mortgage payments: approximately $29,940
Now calculate the annual pre-tax cash flow:
$30,000 (NOI) − $29,940 (mortgage payments) = $60
And the cash-on-cash return:
$60 ÷ $133,000 × 100 = 0.045%
That’s not a typo. The same property with a 6% cap rate produces a cash-on-cash return of less than one-tenth of one percent under current financing conditions. Sixty dollars a year in actual cash flow on a $133,000 cash investment.
This is the revelation most investors need to experience at least once. The property isn’t underperforming — its cap rate is solid. But at 7% financing, the mortgage is consuming nearly all of the NOI. Shift the rate to 6%, and your annual cash flow jumps to roughly $3,024 — pushing cash-on-cash return to around 2.3%. Still modest, but a world apart from near-zero. Drop rates further or increase rents, and the CoC equation changes dramatically.
“Two investors can buy the same property, pay the same price, and walk away with completely different returns. The difference is always in the financing.”
This is precisely why J.P. Morgan’s real estate lending team emphasises cash-on-cash return as a core metric for investors using debt financing — which, practically speaking, is almost every investor in the market.
Why Cash-on-Cash Return Matters for Leveraged Investors
Cash-on-cash return is your year-by-year pulse check on actual deal performance. It tells you whether the property is generating positive cash flow relative to your equity, whether your financing is working for you or against you, and whether you’re building monthly income or simply hoping appreciation bails you out.
According to Investopedia’s cash-on-cash return guide, many active investors target a CoC return of 6–10% or higher, depending on strategy and market. In the current rate environment, hitting that target requires careful deal selection, strong NOI, and sometimes creative financing structures — which is all the more reason to know your numbers precisely before committing capital.
With both metrics clearly defined, the natural next question is: how do they actually stack up against each other — and when should you reach for one versus the other?
Cap Rate vs. Cash-on-Cash Return: The Real Difference, Clearly Explained
Here’s the single most important thing to understand about these two metrics: they are not competing. They are complementary. They answer fundamentally different questions — and confusing one for the other is where costly errors begin.
Cap rate tells you about the property. Cash-on-cash return tells you about your deal.
That one sentence is worth memorising. Let’s break down exactly what each metric is designed to reveal, where they overlap, and where they diverge.
What Each Metric Is Actually Measuring
Cap rate is a property-level metric. It evaluates the asset independently — what it earns relative to what it’s worth, regardless of who owns it, how they bought it, or what interest rate they secured. It’s the same number whether you paid all cash or borrowed 80%. That’s its power and its limitation.
Cash-on-cash return is an investor-level metric. It evaluates your specific position in the deal — what you personally earn relative to what you personally invested. Change the down payment, change the rate, change the loan term, and the cash-on-cash return changes with it. The property stays the same. Your return does not.
The Key Dimensions of Difference
Does it include financing?
Cap rate: No — financing is explicitly excluded. Cash-on-cash return: Yes — the mortgage payment is central to the calculation.
What changes it?
Cap rate changes when NOI changes or when market value changes. Cash-on-cash return changes when NOI changes, when your financing terms change, or when your initial cash investment changes.
Who relies on it most?
Cap rate is the primary language of buyers, brokers, and appraisers comparing properties in a given market. Cash-on-cash return is the primary metric of active investors tracking real cash flow against their deployed capital.
What does it miss?
Cap rate ignores leverage entirely — it can’t tell you whether a deal cash flows positively under your specific loan terms. Cash-on-cash return ignores total property value and equity growth — a property with modest CoC might be building substantial equity through principal paydown and appreciation, none of which CoC captures.
Can they ever be equal?
Yes — exactly one scenario: when an investor pays all cash. With no mortgage, there are no mortgage payments to subtract from NOI, meaning annual cash flow equals NOI. And with no financing, total cash invested equals purchase price. The formulas become mathematically identical. This is a useful conceptual bridge between the two metrics — it reinforces that cap rate is your cash-on-cash return in an all-cash world.
As BiggerPockets explains in their definitive breakdown, the two metrics are best understood as complementary lenses rather than substitutes. Using only one is like trying to navigate with half a map.
When They Diverge Most Dramatically
The gap between cap rate and cash-on-cash return widens in two specific scenarios:
High-leverage deals in high-rate environments — as demonstrated in the worked example above. A solid cap rate can mask near-zero or negative cash-on-cash returns when mortgage payments consume most of the NOI. This is the environment many investors are navigating in 2025–2026, where investment property rates sit in the 6.9–7.4% range.
Premium market properties — markets like coastal metros often price properties at cap rates of 3–5%, meaning the income yield is relatively low relative to value. An investor using significant leverage in these markets may find that financing costs outpace income entirely — making cash-on-cash return a critical gut-check before committing.
According to Plante Moran’s analysis of real estate return metrics, sophisticated investors consistently use both metrics in tandem — not as competing scorecards, but as different lenses on the same deal.
The knowledge of what these metrics tell you is valuable. The knowledge of when to use each one is where real edge is found.
When to Reach for Each Metric: A Lifecycle Guide for Smart Investors
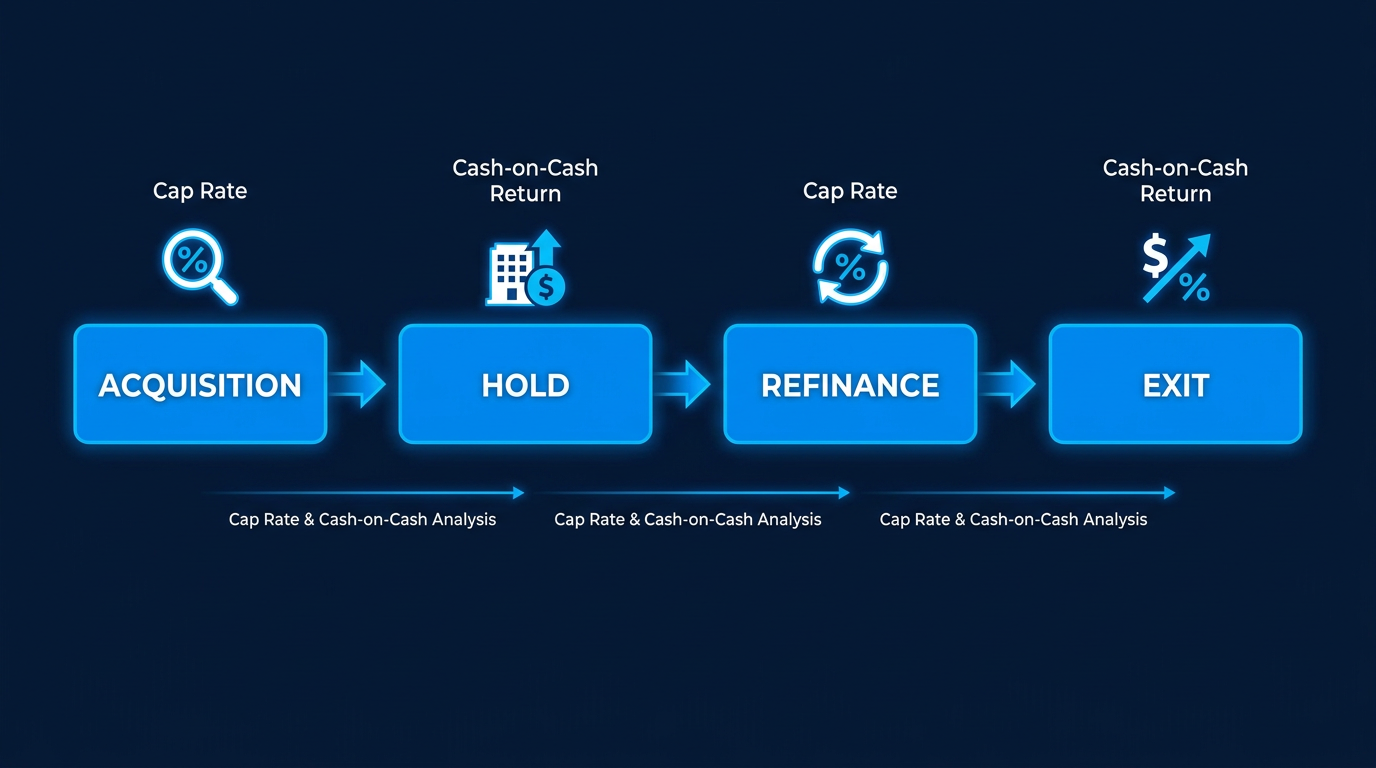
Knowing the difference between cap rate and cash-on-cash return is table stakes. Knowing when each one should be driving your decision — that’s where experienced investors separate themselves from the pack. These metrics have natural homes in the investment lifecycle, and using the right tool at the right stage gives you both clarity and confidence.
At Acquisition: Shopping and Screening Properties
When you’re evaluating properties in a market — comparing a twelve-unit apartment building against a portfolio of single-family rentals, or assessing whether a seller’s asking price is reasonable — cap rate is your primary screening tool. It strips out financing variables and gives you a clean, apples-to-apples income efficiency comparison.
Use cap rate to answer: “Is this property priced appropriately for what it earns?” If the prevailing cap rate in a submarket is 6% and a property is offered at an implied cap rate of 4.5%, the seller is either pricing in significant rent growth assumptions or simply asking too much. Cap rate tells you that immediately, without any knowledge of your financing terms.
Once you have a property that passes the cap rate screen — meaning it looks reasonable relative to market norms — then you run your cash-on-cash return analysis. Plug in your actual loan terms: the rate you’ve been quoted, the down payment your lender requires, the closing costs you’ve estimated. Now you can see whether your version of this deal actually generates the cash flow you need.
As BiggerPockets’ glossary on capitalization rate notes, cap rate is the entry-point metric for most investors — but it’s never the last word.
Practical rule: Use cap rate to evaluate the property. Use cash-on-cash return to evaluate your position in the deal.
During the Hold Period: Tracking Performance
Once you own the property, cash-on-cash return becomes your primary ongoing performance metric. It reflects your real monthly and annual cash position — the actual dollars flowing through the property after the bank, the property manager, and the taxman have all taken their share.
Track CoC annually. When rents rise, when expenses increase, when a unit sits vacant for two months — your cash-on-cash return will move. That movement tells you how the property is actually performing against the equity you have deployed.
Cap rate still matters during the hold period, but in a different way: it tells you how the market is valuing your asset as conditions evolve. If cap rates in your submarket have compressed from 6% to 5% since you bought, that means your property has likely appreciated — the same NOI now implies a higher market value. Tracking that movement informs refinancing decisions and portfolio strategy.
At Refinance: Recalculating Your Position
A refinance event is a significant reset for your cash-on-cash return — and it demands a full recalculation. A cash-out refinance increases your loan balance and your monthly payments, which reduces cash flow. An interest rate reduction does the opposite. Either way, your total cash invested may change, and your annual cash flow will change — meaning your CoC changes with it.
Cap rate, by contrast, is largely unaffected by a refinance event (assuming NOI and market value remain stable). This stability is part of what makes cap rate valuable for benchmarking the property’s intrinsic performance independently of how your financing evolves.
At Exit: Understanding What Your Buyer Sees
When it’s time to sell, cap rate comes back to the forefront — because it’s the lens your buyer will use to evaluate your asking price. The exit cap rate you underwrite at acquisition is one of the most important assumptions in your original deal model: if you bought at a 6% cap and you’re projecting to sell at a 5.5% cap (cap rate compression), you’re baking in appreciation. If cap rates have expanded, you may exit at a lower price than anticipated even if NOI has grown.
Cash-on-cash return over your total hold period tells the other side of the story: how your equity performed year by year from your initial investment through to exit. It’s the retrospective scorecard on your actual investor experience.
Together, they give you a complete picture of both the property’s market performance and your personal investment outcome. That two-lens approach is what rigorous investors use — and even the best analysis breaks down if the underlying data isn’t accurate.
The Most Common Mistakes Investors Make with These Metrics
Even experienced investors get these metrics wrong. Not always from lack of understanding — more often from bad habits, incomplete data, or assumptions that quietly distort every number downstream. Here are the six mistakes most worth avoiding.

Mistake 1: Confusing cap rate for your actual return on a leveraged deal.
Cap rate tells you about the property’s income efficiency — not your yield as a financed investor. If you borrow money to buy a property with a 6% cap rate, your return is not 6%. Depending on your loan terms, it could be higher, lower, or even negative. Many newer investors make this mistake and are surprised when cash flow doesn’t materialise the way they expected.
Mistake 2: Using gross rent instead of NOI in the cap rate formula.
This is the most common computational error — and it overstates cap rate dramatically. If a property generates $48,000 in gross rent and you divide that by a $500,000 purchase price, you get a cap rate of 9.6%. But that ignores every operating expense. The real cap rate, after accounting for $18,000 in expenses, is 6%. That’s a 60% overstatement — significant enough to completely change your investment decision.
Mistake 3: Omitting vacancy from the NOI calculation.
Assuming 100% occupancy is a seductive fantasy. Every rental property will have vacancy — tenant turnover, lease-up periods, market softness. A standard vacancy allowance of 5–10% should be built into every NOI calculation. Skipping this step inflates your NOI, overstates cap rate, and sets you up for a cash flow shortfall the moment a tenant moves out.
Mistake 4: Understating total cash invested in the CoC formula.
Investors often include the down payment and stop there. But total cash invested must capture every dollar you deployed: down payment, closing costs, initial repairs, deferred maintenance reserves, pre-leasing carrying costs. Forgetting a $15,000 renovation and $8,000 in closing costs artificially inflates your cash-on-cash return — making a mediocre deal look better than it is.
Mistake 5: Treating these metrics as static, one-time calculations.
Cap rate and cash-on-cash return are living numbers. They change when rents move, when expenses increase, when you refinance, when market values shift. Many investors calculate them once at acquisition and never revisit them — which means they’re navigating with a map that’s years out of date. Both metrics should be recalculated at least annually, and immediately after any material change to the property’s income, expenses, or financing.
Mistake 6: Basing the calculations on inaccurate or incomplete financial data.
This is the root cause of every other mistake on this list. If your income figures are rough estimates, if your expenses are recalled from memory, if your records mix up costs across multiple properties — every formula you run produces a number that can’t be trusted. Garbage in, garbage out. The formula is only as reliable as the data you feed it. Clean, categorised, property-level financial records aren’t a nice-to-have — they’re the foundation that makes all of this analysis meaningful.
That last mistake leads directly to the most overlooked part of real estate investing: the quality of the financial infrastructure behind your numbers.
Clean Data Is Everything: Why Accurate Bookkeeping Powers Accurate Metrics
Every formula in this guide is only as good as the numbers you put into it. NOI requires knowing — with precision — every dollar of income your property generates and every dollar of operating expense it consumes. Not approximately. Not at year-end from a bank statement. Actually, at the property level, in real time.
That sounds obvious. In practice, it’s where most investors fall short.
The Spreadsheet Trap
The majority of real estate investors are calculating NOI from memory, rough estimates, or a patchwork of bank statements and receipts assembled once a year before tax season. They’re not tracking expenses at the property level. They’re not accounting correctly for management fees, maintenance costs, or vacancy. They’re not distinguishing between capital improvements and operating expenses — a distinction that matters both for tax purposes and for accurate NOI calculation.
The result is systematic distortion in every metric they calculate. A cap rate that’s 1–2% higher than reality. A cash-on-cash return that looks solid until the actual cash flow tells a different story. Investment decisions made on numbers that were never accurate to begin with.
At two properties, this might be manageable. You can keep a lot in your head. At five, eight, or twelve — the margin for error compounds. A portfolio of ten properties with systematically overstated NOI isn’t just misleading — it’s a liability. Mispriced refinances. Incorrect exit assumptions. Overpaying for acquisitions benchmarked against inflated cap rate comps.
What Accurate, Property-Level Bookkeeping Actually Unlocks
When your financial records are clean, categorised, and tracked at the property level, everything changes:
- Your cap rate calculations are grounded in real NOI — not estimates. You can calculate it at any point in the year, not just at tax time.
- Your cash-on-cash return reflects actual cash flow — what genuinely landed in your account versus what went out.
- You can benchmark individual properties against each other — identifying which assets are outperforming and which need attention.
- You make decisions with confidence — because you know the numbers behind them are real.
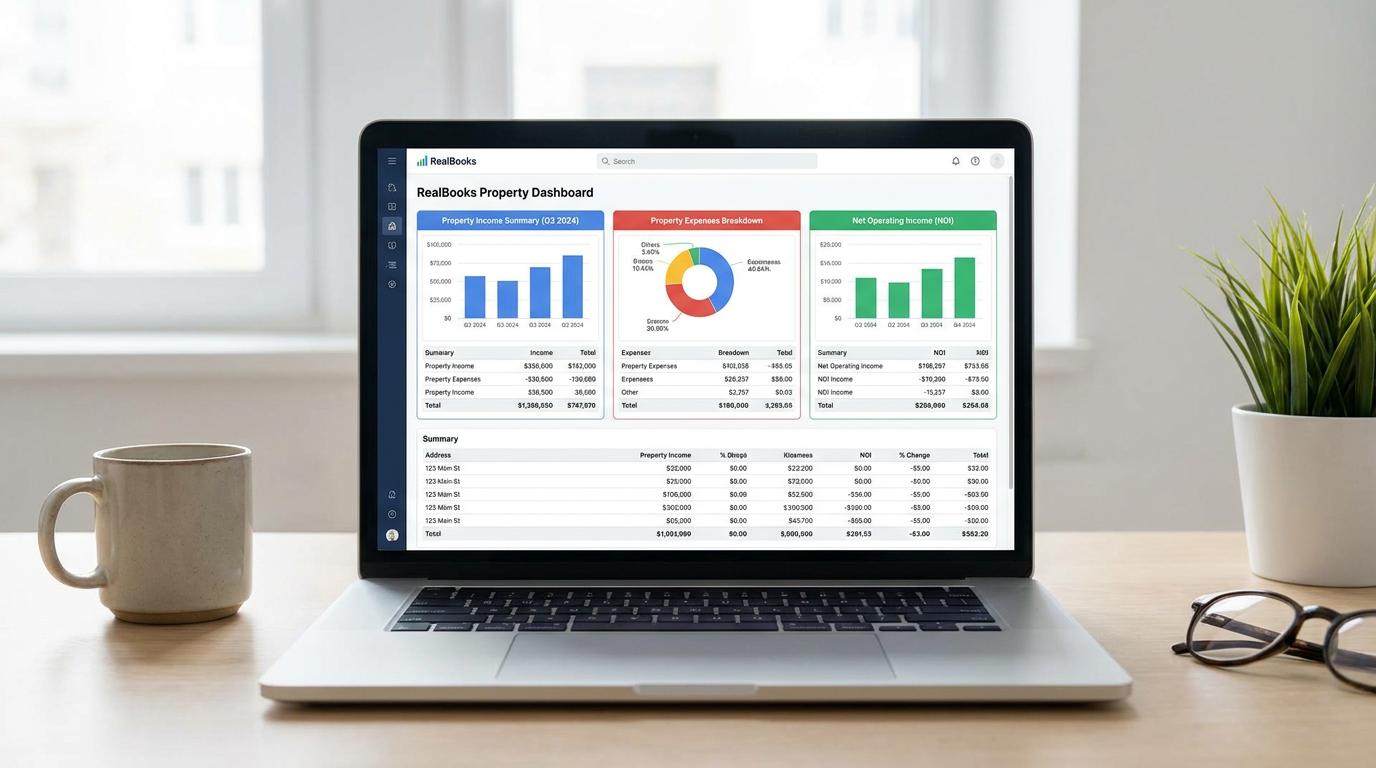
This is exactly what RealBooks is built to deliver. The platform tracks income and expenses at the property level in real time — automatically categorising transactions through its Autonomous General Ledger, so that when it’s time to calculate cap rate or cash-on-cash return, the underlying data is already there, already clean, already current. See how it works at realbooks.io.
“Your numbers should work as hard as your investments do.”
The investors who make the best decisions aren’t just the ones who understand the formulas. They’re the ones with the systems that keep their numbers accurate all year long — so every cap rate calculation, every cash-on-cash analysis, and every acquisition decision is grounded in data they can trust.
Frequently Asked Questions: Cap Rate and Cash-on-Cash Return
What is the difference between cap rate and cash-on-cash return?
Cap rate measures a property’s net operating income relative to its value, assuming an all-cash purchase — financing is excluded. Cash-on-cash return measures the actual annual cash flow you receive relative to the cash you personally invested in the deal, including the impact of your mortgage. Cap rate evaluates the property; cash-on-cash return evaluates your position in the deal. The two metrics answer different questions, and sophisticated investors use both.
Is a higher cap rate always better?
Not necessarily. A higher cap rate typically means a higher income yield relative to property value — which sounds appealing. But it often signals higher risk: a less competitive market, higher vacancy potential, an older asset with deferred maintenance, or a location with weaker demand fundamentals. According to Investopedia’s cap rate overview, cap rate should always be interpreted in market context. A 9% cap rate in a tertiary market may carry far more risk than a 5% cap rate in a high-demand urban core. Higher isn’t automatically better — it’s always a signal worth investigating.
What is a good cap rate for a rental property?
It depends heavily on market, asset class, and your investment strategy. As a general framework for 2026: Class A multifamily in major metros typically trades at 4–5.5%. Class B multifamily at 5.5–7%. Single-family rentals in strong markets at 3–5%, in secondary markets at 5–7%. “Good” is always relative to what’s normal for that asset class in that market — not a universal number. A cap rate that would be considered excellent in San Francisco would be considered mediocre in a smaller Midwest market.
What is a good cash-on-cash return?
Most active investors target a cash-on-cash return of 6–10% or higher, though what’s achievable depends significantly on the current interest rate environment. In the 2025–2026 rate landscape, with investment property mortgage rates in the 6.9–7.4% range, generating strong CoC on a standard leverage deal requires careful NOI optimisation and deal selection. Value-add strategies — buying below market, improving operations, increasing rents — are one of the primary ways investors drive CoC into the double-digit range even in higher-rate environments.
Can cap rate and cash-on-cash return ever be the same number?
Yes — in exactly one scenario: when you purchase a property entirely with cash. With no mortgage, there are no mortgage payments to deduct from NOI, so annual pre-tax cash flow equals NOI. And with no financing, total cash invested equals the full purchase price. The cap rate formula and the cash-on-cash formula become mathematically identical. This is the conceptual bridge between the two metrics — cap rate is, in essence, the cash-on-cash return you’d earn in an all-cash world. The moment leverage enters the picture, the two metrics diverge.
How often should I recalculate these metrics?
At minimum, annually — and immediately following any material change: a rent increase, a significant expense, a refinancing event, or a notable shift in your market’s property values. Ideally, with clean, property-level bookkeeping in place, you should be able to check both metrics at any point throughout the year — not just at tax season. Real-time financial data means real-time decision-making capability. That’s the difference between reacting to your portfolio and actively managing it.
Do these metrics apply to short-term rentals?
Both metrics apply to short-term rentals, but with important caveats. STR income is significantly more variable than long-term rental income — it fluctuates with seasonality, platform algorithm changes, and local regulation. This variability makes accurate NOI estimation more challenging and requires more conservative vacancy assumptions. Cash-on-cash return is still valid and arguably more important in the STR context, given the higher upfront capital often involved (furnishing, licensing). The discipline of clean, platform-level income tracking is even more critical for STR operators — making purpose-built financial systems essential rather than optional.

Two Metrics, One Smarter Strategy
Cap rate and cash-on-cash return are not competing formulas vying for your attention. They are two lenses on the same deal — one focused on the property, one focused on your position in it. Using both, in the right context, at the right stage of the investment lifecycle, is what separates reactive investors from confident ones.
The property’s cap rate tells you whether it’s priced appropriately for its income potential and how it compares to alternatives in the market. Your cash-on-cash return tells you whether your specific version of that deal — with your financing, your down payment, your cost basis — is actually generating the returns you need. Together, they give you the full picture. Alone, each one leaves a critical gap.
But there’s a reality beneath both formulas that doesn’t get enough attention: these numbers are only as trustworthy as the data that feeds them. An inaccurate NOI produces an inaccurate cap rate. An incomplete cash flow figure produces a misleading cash-on-cash return. The best investors don’t just understand the formulas — they have systems that keep their numbers accurate, current, and organised at the property level all year long.
Your numbers should work as hard as your investments do.
At two properties, a spreadsheet might hold. At five, eight, or fifteen — you need infrastructure that scales with your ambition. Clean books aren’t just a tax-season concern. They’re the foundation of every smart acquisition, every confident refinance, and every strategic exit.
Ready to make sure your cap rate and cash-on-cash calculations are backed by accurate, property-level data?
Know an investor who’s been running the numbers on estimates? Share this with them.
Ready to maximize your tax savings?
RealBooks automatically tracks expenses, manages assets, and calculates depreciation across your entire portfolio.
Start Free Trial →